Balbharati Maharashtra State Board 11th Commerce Maths Solution Book Pdf Chapter 6 Permutations and Combinations Ex 6.3 Questions and Answers.
Maharashtra State Board 11th Commerce Maths Solutions Chapter 6 Permutations and Combinations Ex 6.3
Question 1.
Find n if nP6 : nP3 = 120 : 1
Solution:
nP6 : nP3 = 120 : 1
∴ \(\frac{n !}{(n-6) !} \div \frac{n !}{(n-3) !}=\frac{120}{1}\)
∴ \(\frac{\mathrm{n} !}{(\mathrm{n}-6) !} \times \frac{(\mathrm{n}-3) !}{\mathrm{n} !}\) = 120
∴ \(\frac{n !}{(n-6) !} \times \frac{(n-3)(n-4)(n-5)(n-6) !}{n !}\) = 120
∴ (n – 3) (n – 4) (n – 5) = 120
∴ (n – 3) (n – 4) (n – 5) = 6 × 5 × 4
Comparing on both sides, we get
n – 3 = 6
∴ n = 9
![]()
Question 2.
Find m and n if (m+n)P2 = 56 and (m-n)P2 = 12
Solution:
m+nP2 = 56
∴ \(\frac{(\mathrm{m}+\mathrm{n}) !}{(\mathrm{m}+\mathrm{n}-2) !}\) = 56
∴ \(\frac{(m+n)(m+n-1)(m+n-2) !}{(m+n-2) !}\) = 56
∴ (m + n) (m + n – 1) = 8 × 7
Comparing on both sides, we get
m + n = 8 …..(i)
Also m-nP2 = 12
∴ \(\frac{(m-n) !}{(m-n-2) !}\) = 12
∴ \(\frac{(m-n)(m-n-1)(m-n-2) !}{(m-n-2) !}\) = 12
∴ (m – n) (m – n – 1) = 4 × 3
Comparing on both sides, we get
m – n = 4 …..(ii)
Adding (i) and (ii), we get
2m = 12
∴ m = 6
Substituting m = 6 in (ii), we get
6 – n = 4
∴ n = 2
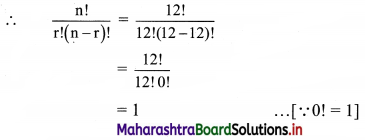
Question 3.
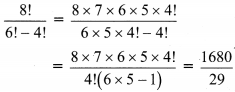
Find r if 12Pr-2 : 11Pr-1 = 3 : 14
Solution:
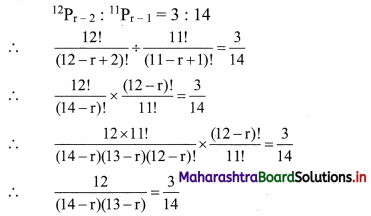
∴ (14 – r)(13 – r) = 8 × 7
Comparing on both sides, we get
14 – r = 8
∴ r = 6
Question 4.
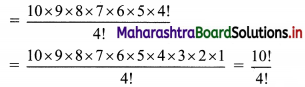
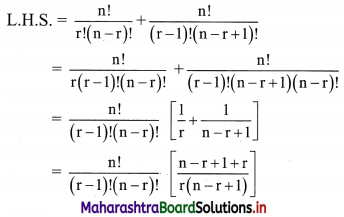
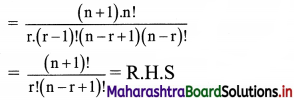
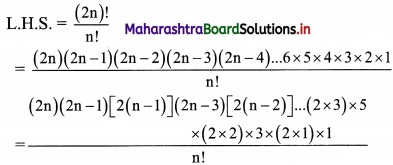
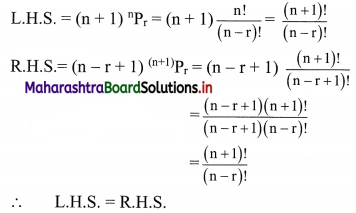
Show that (n + 1) nPr = (n – r + 1) (n+1)Pr.
Solution:
Question 5.
How many 4 letter words can be formed using letters in the word MADHURI if
(i) letters can be repeated?
(ii) letters cannot be repeated?
Solution:
There are 7 letters in the word MADHURI.
(i) A 4 letter word is to be formed from the letters of the word MADHURI and repetition of letters is allowed.
∴ 1st letter can be filled in 7 ways.
2nd letter can be filled in 7 ways.
3rd letter can be filled in 7 ways.
4th letter can be filled in 7 ways.
∴ Total no. of ways a 4-letter word can be formed = 7 × 7 × 7 × 7 = 2401
∴ 2401 four-lettered words can be formed when repetition of letters is allowed.
(ii) When repetition of letters is not allowed, the number of 4-letter words formed from the letters of the word MADHURI is
7P4 = \(\frac{7 !}{(7-4) !}=\frac{7 \times 6 \times 5 \times 4 \times 3 !}{3 !}\) = 840
∴ 840 four-letter words can be formed when repetition of letters is not allowed.
![]()
Alternate method:
There are 7 letters in the word MADHURI.
(i) Since letters can be repeated
∴ In all places of a four-letter word, any one of seven letters M, A, D, H, U, R, I can appear.
∴ Using the Multiplication theorem, we get
Number of four-letter words with repetition of letters M, A, D, H, U, R, I = 7 × 7 × 7 × 7 = 2401
(ii) Since the letters cannot be repeated therefore 1st, 2nd, 3rd, 4th places can be filled in 7, 6, 5, 4 ways respectively
∴ Using the multiplication theorem, we get
Number of four-letter words, with no repetition of letters M, A, D, H, U, R, I = 7 × 6 × 5 × 4 = 840
Question 6.
Determine the number of arrangements of letters of the word ALGORITHM if
(i) vowels are always together.
(ii) no two vowels are together.
(iii) Consonants are at even positions
(iv) O is first and T is last.
Solution:
A word is to be formed using the letters of the word ALGORITHM.
There are 9 letters in the word ALGORITHM.
(i) When vowels are always together:
There are 3 vowels in the word ALGORITHM. (i.e, A, I, O)
Let us consider these 3 vowels as one unit.
This unit with 6 other letters is to be arranged.
∴ It becomes an arrangement of 7 things which can be done in 7P7 i.e., 7! ways and 3 vowels can be arranged among themselves in 3P3 i.e., 3! ways.
∴ the total number of ways in which the word can be formed = 7! × 3!
= 5040 × 6
= 30240
∴ 30240 words can be formed if vowels are always together.
(ii) When no two vowels are together:
There are 6 consonants in the word ALGORITHM.
They can be arranged among themselves in 6P6 i.e., 6! ways.
Let consonants be denoted by C.
_C_C_ C_C_C_C_
6 consonants create 7 gaps in which 3 vowels are to arranged.
∴ 3 vowels can be filled in 7P3
= \(\frac{7 !}{(7-3) !}\)
= \(\frac{7 \times 6 \times 5 \times 4 !}{4 !}\)
= 210 ways
∴ total number of ways in which the word can be formed = 6! × 210
= 720 × 210
= 151200
∴ 151200 words can be formed if no two vowels are together.
(iii) When consonants are at even positions:
There are 4 even places and 6 consonants in the word ALGORITHM.
1st, 2nd, 3rd, 4th even places are filled in 6, 5, 4, 3 way respectively.
∴ The number of ways to fill four even places by consonants = 6 × 5 × 4 × 3 = 360
The remaining 5 letters (3 vowels and 2 consonants) can be arranged among themselves in 5P5 i.e., 5! ways.
∴ Total number of ways the words can be formed
In which even places are occupied by consonants = 360 × 5!
= 360 × 120
= 43200
∴ 43200 words can be formed if even positions are occupied by consonants.
(iv) When beginning with O and ends with T:
All the letters of the word ALGORITHM are to be arranged among themselves such that arrangement begins with O and ends with T.
7 letters other than O and T can be filled between O and T in 7P7 i.e., 7! ways = 5040 ways.
∴ 5040 words beginning with O and ending with T can be formed.
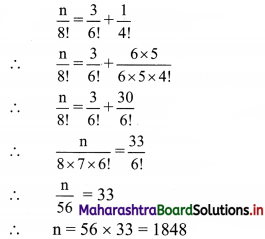
Question 7.
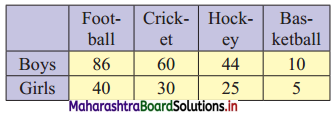
In a group photograph, 6 teachers and principals are in the first row and 18 students are in the second row. There are 12 boys and 6 girls among the students. If the middle position is reserved for the principal and if no two girls are together, find the number of arrangements.
Solution:
In 1st row middle seat is fixed for the principal.
Also 1st row, 6 teachers can be arranged among themselves in 6P6 i.e., 6! ways.
In the 2nd row, 12 boys can be arranged among themselves in 12P12 i.e., 12! ways.
13 gaps are created by 12 boys, in which 6 girls are to be arranged.
together which can be done in 13P6 ways.
∴ total number of arrangements = 6! × 12! × 13P6 …..[using Multiplications Principle]
= 6! × 12! × \(\frac{13 !}{(13-6) !}\)
= 6! × 12! × \(\frac{13 !}{7 !}\)
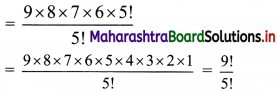
= \(\frac{6 ! \times 12 ! \times 13 !}{7 \times 6 !}\)
= \(\frac{12 ! 13 !}{7}\)
![]()
Question 8.
Find the number of ways letters of the word HISTORY can be arranged if
(i) Y and T are together
(ii) Y is next to T.
Solution:
There are 7 letters in the word HISTORY
(i) When ‘Y’ and ‘T’ are together.
Let us consider ‘ Y’ and ‘T’ as one unit
This unit with the other 5 letters is to be arranged.
∴ The number of arrangements of one unit and 5 letters = 6P6 = 6!
Also, ‘Y’ and ‘T’ can be arranged among themselves in 2P2 i.e., 2! ways.
∴ a total number of arrangements when Y and T are always together = 6! × 2!
= 720 × 2
= 1440
∴ 1440 words can be formed if Y and T are together.
(ii) When ‘Y’ is next to ‘T’
Let us take this (‘Y’ next to ‘T’) as one unit.
This unit with 5 other letters is to be arranged.
∴ The number of arrangements of 6 letters and one unit = 6P6 = 6!
Also ‘Y’ has to be always next to ‘T’.
So they can be arranged in 1 way.
∴ total number of arrangements possible when Y is next to T = 6! × 1 = 720
∴ 720 words can be formed if Y is next to T.
Question 9.
Find the number of arrangements of the letters in the word BERMUDA so that consonants and vowels are in the same relative positions.
Solution:
There are 7 letters in the word “BERMUDA” out of which 3 are vowels and 4 are consonants.
If relative positions of consonants and vowels are not changed.
3 vowels can be arranged among themselves in 3P3 i.e., 3! ways.
4 consonants can be arranged among themselves in 4P4 i.e., 4! ways.
∴ total no. of arrangements possible if relative positions of vowels and consonants are not changed = 3! × 4!
= 6 × 24
= 144
Question 10.
Find the number of 4-digit numbers that can be formed using the digits 1, 2, 4, 5, 6, 8 if
(i) digits can be repeated
(ii) digits cannot be repeated
Solution:
(i) A 4 digit number is to be made from the digits 1, 2, 4, 5, 6, 8 such that digits can be repeated.
∴ The unit’s place digit can be filled in 6 ways.
10’s place digit can be filled in 6 ways.
100’s place digit can be filled in 6 ways.
1000’s place digit can be filled in 6 ways.
∴ total number of numbers = 6 × 6 × 6 × 6 = 64 = 1296
∴ 1296 four-digit numbers can be formed if repetition of digits is allowed.
(ii) A 4 different digit number is to be made from the digits 1, 2, 4, 5, 6, 8 without repetition of digits.
∴ 4 different digits are to be arranged from 6 given digits which can be done in 6P4
= \(\frac{6 !}{(6-4) !}\)
= \(\frac{6 \times 5 \times 4 \times 3 \times 2 !}{2 !}\)
= 360 ways
∴ 360 four-digit numbers can be formed, if repetition of digits is not allowed.
![]()
Question 11.
How many numbers can be formed using the digits 0, 1, 2, 3, 4, 5 without repetition so that the resulting numbers are between 100 and 1000?
Solution:
A number between 100 and 1000 is a 3 digit number and is to be formed from the digits 0, 1, 2, 3, 4, 5, without repetition of digits.
∴ 100’s place digit must be a non-zero number which can be filled in 5 ways.
10’s place digits can be filled in 5 ways.
Unit’s place digit can be filled in 4 ways.
∴ total number of ways the number can be formed = 5 × 5 × 4 = 100
∴ 100 numbers between 100 and 1000 can be formed.
Question 12.
Find the number of 6-digit numbers using the digits 3, 4, 5, 6, 7, 8 without repetition. How many of these numbers are
(i) divisible by 5?
(ii) not divisible by 5?
Solution:
A number of 6 different digits is to be formed from the digits 3, 4, 5, 6, 7, 8 which can be done in 6P6 i.e., 6! = 720 ways
(i) If the number is divisible by 5, then
The unit’s place digit must be 5, and hence unit’s place can be filled in 1 way
Other 5 digits can be arranged among themselves in 5P5 i.e., 5! ways
∴ Total number of ways in which numbers divisible by 5 can be formed = 1 × 5! = 120
(ii) If the number is not divisible by 5, then
Unit’s place can be any digit from 3, 4, 6, 7, 8 which can be selected in 5 ways.
Other 5 digits can be arranged in 5P5 i.e., 5! ways
∴ The total number of ways in which numbers not divisible by 5 can be formed = 5 × 5!
= 5 × 120
= 600
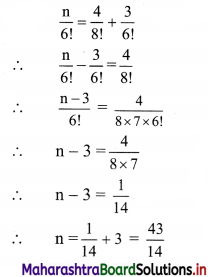
Question 13.
A code word is formed by two distinct English letters followed by two non-zero distinct digits. Find the number of such code words. Also, find the number of such code words that end with an even digit.
Solution:
(i) There is a total of 26 alphabets.
A code word contains 2 English alphabets.
∴ 2 alphabets can be filled in 26P2
= \(\frac{26 !}{(26-2) !}\)
= \(\frac{26 \times 25 \times 24 !}{24 !}\)
= 650 ways
Also, alphabets to be followed by two distinct non-zero digits from 1 to 9 which can be filled in 9P2
= \(\frac{9 !}{(9-2) !}\)
= \(\frac{9 \times 8 \times 7 !}{7 !}\)
= 72 ways
∴ Total number of a code words = 650 × 72 = 46800
![]()
(ii) There are total 26 alphabets.
A code word contains 2 English alphabets.
∴ 2 alphabets can be filled in 26P2
= \(\frac{26}{(26-2) !}\)
= \(\frac{26 \times 25 \times 24 !}{24 !}\)
= 650 ways
For a code word to end with an even integer, the digit in the unit’s place should be an even number between 1 to 9 which can be filled in 4 ways.
Also, 10’s place can be filled in 8 ways.
∴ Total number of codewords = 650 × 4 × 8 = 20800 ways
∴ 20800 codewords end with an even integer.
Question 14.
Find the number of ways in which 5 letters can be posted in 3 post boxes if any number of letters can be posted in a post box.
Solution:
There are 5 letters and 3 post boxes and any number of letters can be posted in all three post boxes.
∴ Each letter can be posted in 3 ways.
∴ Total number of ways in which 5 letters can be posted = 3 × 3 × 3 × 3 × 3 = 243
Question 15.
Find the number of arranging 11 distinct objects taken 4 at a time so that a specified object
(i) always occurs
(ii) never occurs
Solution:
There are 11 distinct objects and 4 are to be taken at a time.
(i) The number of permutations of n distinct objects, taken r at a time, when one specified object will always occur is r × (n-1)P(r-1)
Here, r = 4, n = 11
∴ The number of permutations of 4 out of 11 objects when a specified object occurs.
= 4 × (11-1)P(4-1)
= 4 × 10P3
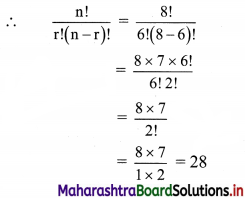
= 4 × \(\frac{10 !}{(10-3) !}\)
= 4 × \(\frac{10 !}{7 !}\)
= 4 × \(\frac{10 \times 9 \times 8 \times 7 !}{7 !}\)
= 2880
∴ There are 2880 permutations of 11 distinct objects, taken 4 at a time, in which one specified object always occurs.
![]()
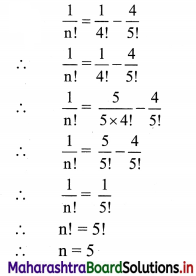
(ii) When one specified object does not occur then 4 things are to be arranged from the remaining 10 things, which can be done in 10P4 ways
= 10 × 9 × 8 × 7 ways
= 5040 ways
∴ There are 5040 permutations of 11 distinct objects, taken 4 at a time, in which one specified object never occurs.