Balbharti Maharashtra State Board Class 10 Marathi Solutions Aksharbharati 4 उपास Notes, Textbook Exercise Important Questions and Answers.
Maharashtra State Board Class 10 Marathi Aksharbharati Solutions Chapter 4 उपास
Marathi Aksharbharati Std 10 Digest Chapter 4 उपास Textbook Questions and Answers
प्रश्न 1.
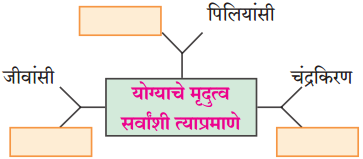
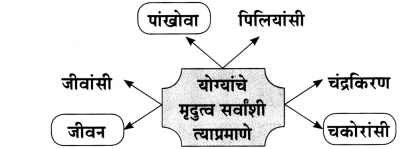
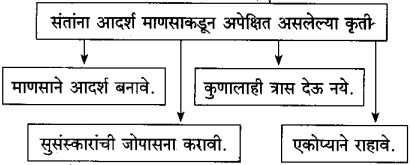
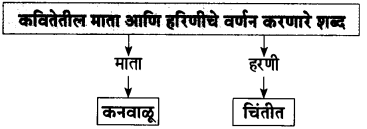
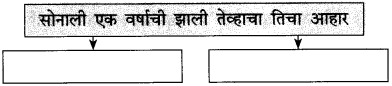
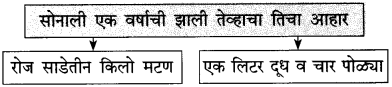
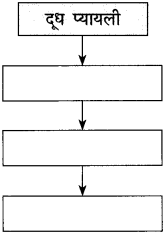
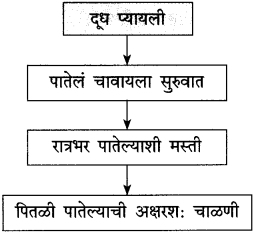
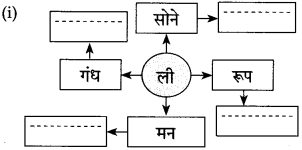
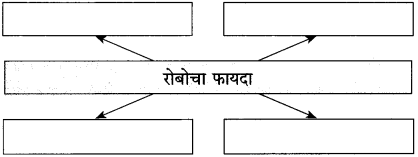
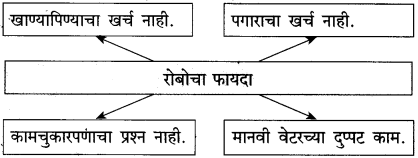
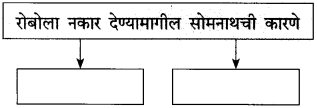
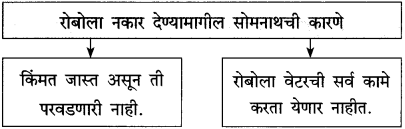
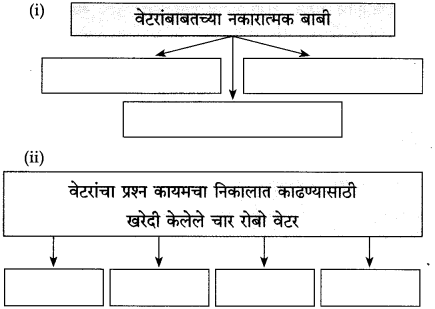
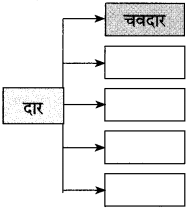
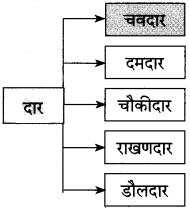
आकृत्या पूर्ण करा.
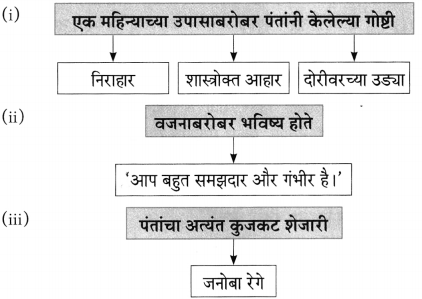
उत्तरः
![]()
प्रश्न 2.
कारणे शोधा.
(अ) वजन कमी करण्यासाठी न बोलण्याचा उपाय पंतांना जमणार नव्हता, कारण ………………………… .
उत्तरः
वजन कमी करण्यासाठी न बोलण्याचा उपाय पंतांना जमणार नव्हता, कारण पंत टेलिफोन ऑपरेटर म्हणून नोकरी करत असल्यामुळे त्यांना दिवसभर बोलावेच लागत होते. न बोलता ते काम करू शकणार नव्हते व काम केले नाही तर खाणार काय? म्हणून.
(आ) बाबा बर्वे पंतांच्या समाचाराला आले नाहीत, कारण ………………………… .
उत्तर:
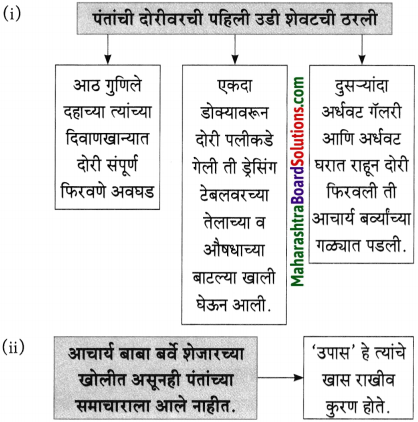
बाबा बर्वे पंतांच्या समाचाराला आले नाहीत कारण उपास हे त्यांचे खास राखीव कुरण होते.
प्रश्न 3.
पाठाधारे खालील संकल्पनांचा अर्थ स्पष्ट करा.
(अ) भीष्म प्रतिज्ञा
(आ) बाळसेदार भाज्या
(इ) वजनाचा मार्ग भलत्याच काट्यातून जातो
(ई) असामान्य मनोनिग्रह
उत्तर:
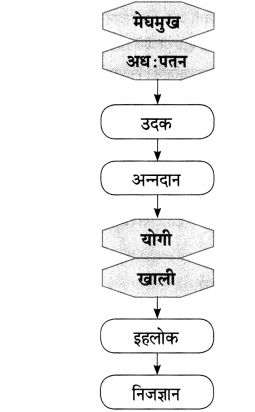
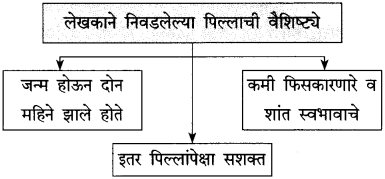
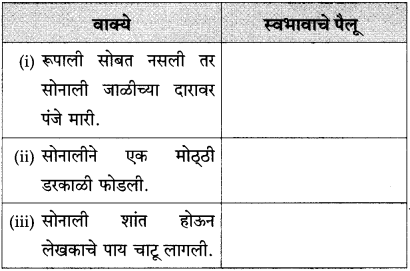
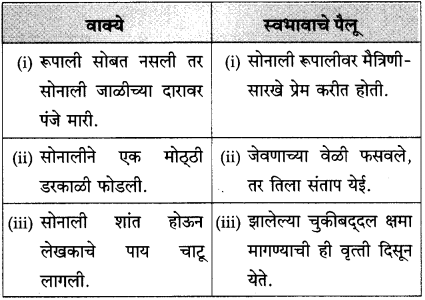
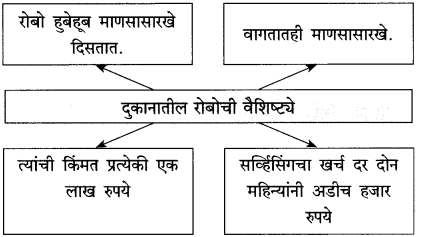
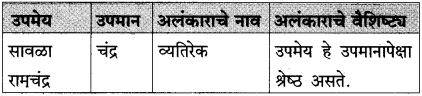
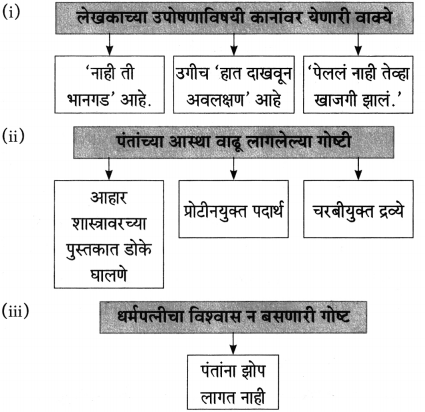
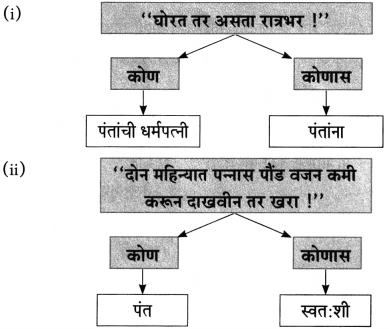
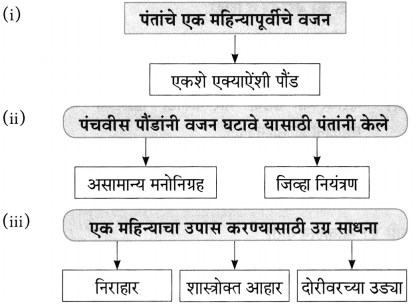
(i) भीष्म प्रतिज्ञा : पंतांनी आपले वजन कमी करण्याचे ठरवल्यावर मित्रांकडून वेगवेगळ्या प्रतिक्रिया येऊ लागल्या. त्यांचे एकशे एक्क्याऐंशी पौंड वजन पाहून त्यांची झोप उडाली. परंतु पंतांची झोप उडाली यावर रात्री घोरण्यामुळे त्याच्या धर्मपत्नीचा विश्वास नव्हता. एकूण सर्वांनीच त्यांची चेष्टा केल्यावर त्यांनी ‘दोन महिन्यात पन्नास पौंड वजन कमी करून दाखवीन तर खरा!’ अशी भीष्मप्रतिज्ञा केली म्हणजेच वजन कमी करण्याचा ठाम निश्चय पंतांनी केला.
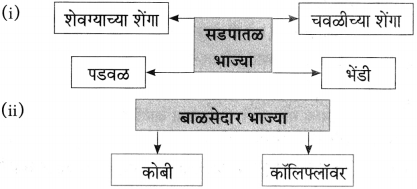
(ii) बाळसेदार भाज्या : पंतांच्या ‘डाएटच्या’ बाबतीतला कुटुंबाचा उत्साह अवर्णनीय होता. रोज काही काही चमत्कारिक पदार्थ त्यांच्या पानात पडायला लागले. बाळसेदार भाज्यांची स्वयंपाकघरातून हकालपट्टी झाली. म्हणजेच कोबी, कॉलिफ्लॉवर अशा बाळसेदार भाज्यांमुळे पंतांचे वजन वाढेल असे वाटल्यामुळे त्या भाज्या कुटुंबाने आणणे सोडून दिले. शिवाय वजन कमी व्हावे म्हणून शेवग्याच्या शेंगा, पडवळ, भेंडी, चवळीच्या शेंगा अशा सडपातळ भाज्या खाणे सुरू केले.
![]()
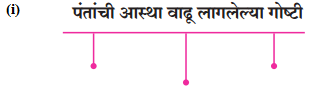
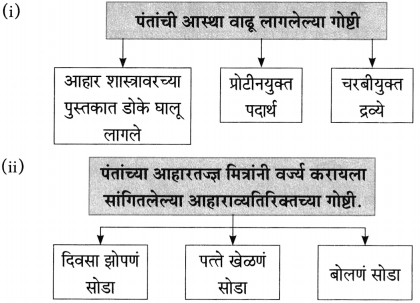
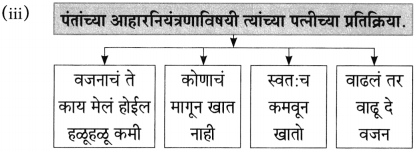
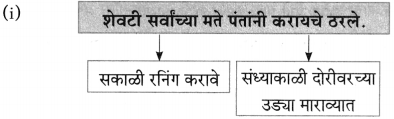
(iii) वजनाचा मार्ग भलत्याच काट्यातून जातो : पंतांनी वजन घटवण्यासाठी आहारशास्त्राची पुस्तके वाचली. चरबीयुक्त द्रव्ये, प्रोटीनयुक्त पदार्थ या शब्दांबद्दलची त्यांची आस्था वाढली, त्यांनी मित्रांचे सल्ले पाळले उदा. दुपारी झोपणे सोडा, पत्ते खेळणे सोडा, रनिंग करा, बोलणे सोडा, तोंडावर ताबा ठेवा, तूप, लोणी, तळलेले पदार्थ खाणे सोडा, दोरीवरच्या उड्या मारा वगैरे, पंतांनी एक महिन्याचा उपास, निराहार, शास्त्रोक्त आहार, दोरीवरच्या उड्या इत्यादी उग्र साधना करूनही पंताचे वजन झाले, ‘एकशे ब्याण्णव पौंड’, त्यामुळे त्यांनी यापुढे जन्मात डाएटच्या आहारी न जाण्याचे ठरवले. कारण त्यांच्या मते एवढे करूनही वजन काही कमी झाले नाही, कारण वजनाचा मार्ग भलत्याच काट्यातून जातो.
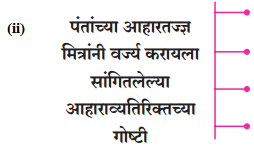
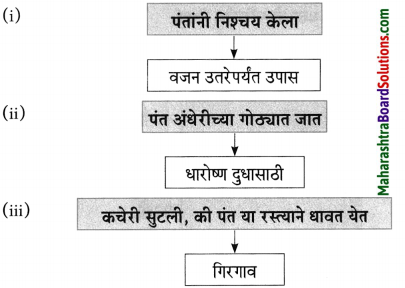
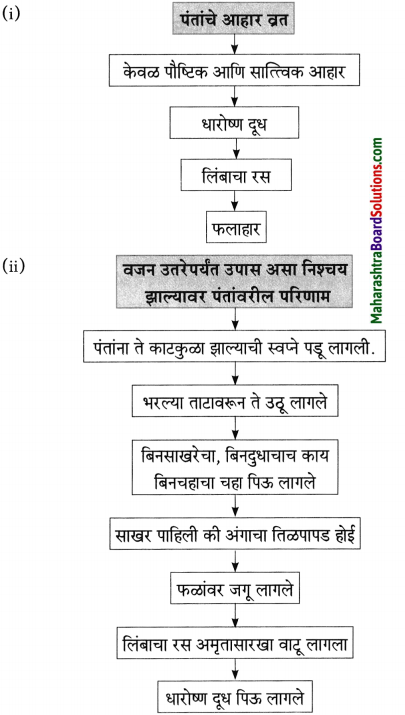
(iv) असामान्य मनोनिग्रहः- मित्र मंडळींचे डाएट बाबतीतले विविध सल्ले पंत पाळत होते. त्यानंतर आचार्य बाबा बर्वे यांच्याकडून मौन पाळण्याचा, तोंडावर ताबा ठेवा, बोलणं सोडा हे सल्ले मिळाल्यावर पंतांनी बोलणं सोडणं शक्य नसल्याचे कबूल केलं. कारण ते टेलिफोन ऑपरेटर होते. मग बाबा म्हणाले की “मग कसलं वजन उतरवणार तुम्ही?” यावर पंतांनी चिडून निश्चय केला बस्स. वजन उतरेपर्यंत उपास! काटकुळे झाल्याची स्वप्न त्यांना पडू लागली, भरल्या ताटावरून ते उठू लागले, बिनासाखरेचा आणि बिनदुधाचाच काय बिनचहाचा चहा ते पिऊ लागले.
साखर पाहून त्यांच्या अंगाचा तिळपापड होई, ते फळांवर जगू लागले, दोरीवरच्या उड्या मारू लागले, कचेरी सुटल्यावर गिरगाव रस्त्याने धावू लागले. पंधरवडाभरात फक्त दोन वेळा साखरभात, एकदा कोळंबीभात, एकदा नागपुरी वडाभात, एवढे अपवाद वगळता त्यांनी भाताला स्पर्श केला नव्हता. पंतांच्या उपासाची चेष्टा करणाऱ्यांनाही पंतांमधील फरक जाणवत होता. पंतांना भीती वाटत होती ती प्रशस्तीने मूठभर मांस वाढण्याची परंतु त्यांचा असामान्य मनोनिग्रह आणि जीभेवर ताबा असल्यामुळे त्यांना वीस ते पंचवीस पौंड वजन कमी होण्याची अपेक्षा होती.
प्रश्न 4.
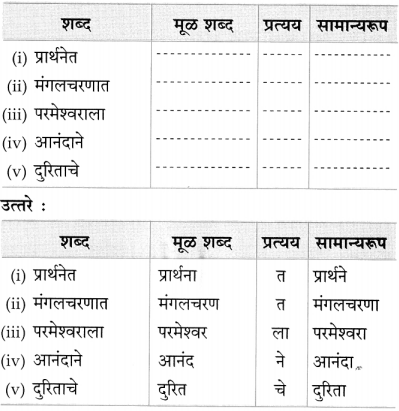
खालील शब्दसमूहासाठी पाठातून एक शब्द शोधा.
(अ) ठरवलेले व्रत मध्येच सोडणे – [ ]
(आ) वजन घटवण्यासाठी आहार बदलण्याची कल्पना – [ ]
(इ) भाषेचा (नदीसारखा) प्रवाह – [ ]
उत्तर:
(अ) ठरवलेले व्रत मध्येच सोडणे – [व्रतभंग]
(आ) वजन घटवण्यासाठी आहार बदलण्याची कल्पना – [आहारपरिवर्तन]
(इ) भाषेचा (नदीसारखा) प्रवाह – [वाक्प्रवाह]
![]()
प्रश्न 5.
अचूक शब्द ओळखून लिहा.
(अ) वडीलांसोबत/वडिलांसोबत/वडिलानसोबत/वडीलानसोबत
(आ) तालमिला/तालमीला/ताल्मीला/ताल्मिला
(इ) गारहाणी/गान्हाणि/गा-हाणी/ग्राहाणी
उत्तर:
(i) वडिलांसोबत
(ii) तालमीला
(iii) गा-हाणी
प्रश्न 6.
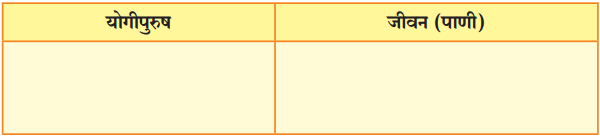
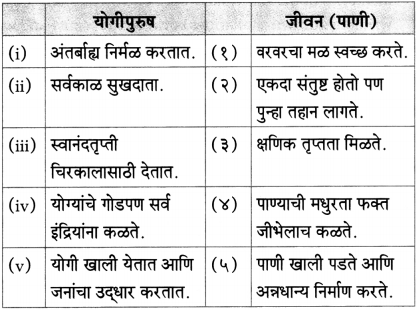
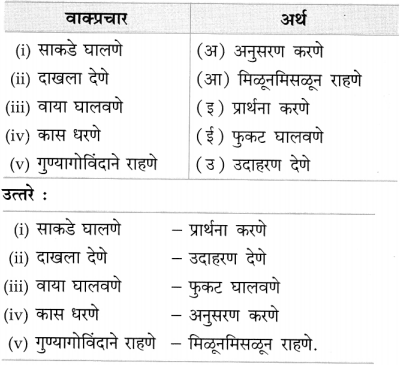
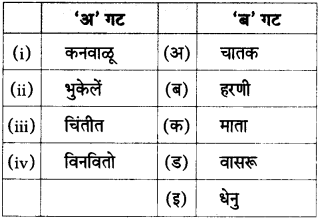
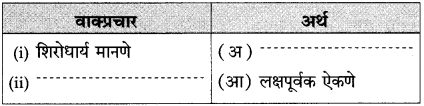
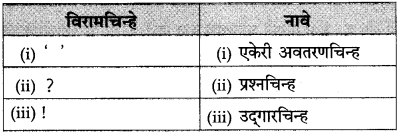
खालील वाक्प्रचार व त्यांचे अर्थ यांच्या जोड्या जुळवा.
उत्तर:
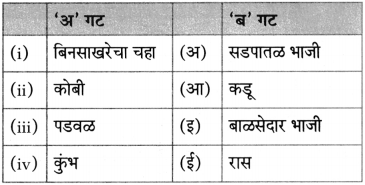
(i – इ),
(ii – ई),
(iii – अ),
(iv – आ)
प्रश्न 7.
स्वमत.
(अ) दोरीवरच्या उड्या मारण्याच्या प्रसंगातील तुम्हांला समजलेला विनोद स्पष्ट करा.
उत्तरः
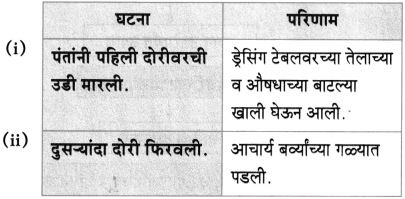
पंतांच्याखाजगी उपोषणाची हकीकत चाळीत जाहीर झाल्यानंतर चाळीतील मित्रमंडळींनी त्यांना सल्ले दयायला सुरुवात केली. कु. कमलिनी केंकरेंनी दोरीवरच्या उड्या मारल्यास वजन घटते असा सल्ला दिला. प्रत्यक्षात पंतांनी जेव्हा दोरीवरच्या उड्या मारण्यास सुरुवात केली. तेव्हा पहिली उडी शेवटची ठरली. त्यांच्या आठ गुणिले दहाच्या खोलीत पूर्ण दोरी फिरवणे शक्य नव्हते. त्यामुळे पहिल्या उडीतच दोरी ड्रेसिंग टेबलवरच्या तेलाच्या बाटल्या औषधाच्या बाटल्या खाली घेऊन आली. दुसरी उडी अर्धवट मारण्याच्या प्रयत्नातच ती आचार्य बाबा बर्वेच्या गळ्यात पडली. त्यांचा आधीच पंतांवर राग होता, त्यात ही दोरी गळ्यात पडली त्यामुळे त्यांना नको-नको ऐकून घ्यावे लागले. अशा प्रकारे दोरीवरच्या प्रत्येक उडीला अडथळे येत होते आणि उड्या मारणे शक्य होत नव्हते.ही हास्यास्पद गोष्ट ठरली.
![]()
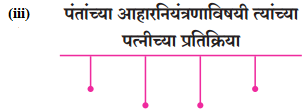
(आ) पंतांच्या उपासाबाबत त्यांच्या पत्नीचा अवर्णनीय उत्साह तुमच्या शब्दांत वर्णन करा.
उत्तर:
पंतांनी वजन कमी करण्यासाठी आहारपरिवर्तन करण्याचे ठरवल्यावर त्यांच्या कुटुंबाचा उत्साह अवर्णनीय होता. रोज काही काही चमत्कारिक पदार्थ पंतांच्या पानात पडायला लागले. एके दिवशी नुसती पडवळे उकडून त्यांनी पंतांना खायला घातली. शेवग्याच्या शेंगा, पडवळ, भेंडी, चवळीच्या शेंगा वगैरे सडपातळ भाज्यांचा खुराक पंतांना देणे त्यांनी चालू केला. कोबी, कॉलिफ्लॉ वर वगैरे बाळसेदार मंडळींची स्वयंपाक घरातून हकालपट्टी झाली. सकाळचा चहा देखील पूर्वीसारखा राहिला नाही. अशा प्रकारे पंतांच्या पत्नीचा अवर्णनीय उत्साह दिसून आला.
(इ) पाठातील तुम्हाला सर्वांत आवडलेला विनोद कोणता? तो का आवडला ते स्पष्ट करा.
उत्तर:
पंतांनी असामान्य मनोनिग्रह आणि जिव्हनियंत्रणानंतर कमीत कमी वीस ते पंचवीस पौंडानी वजन घटेल अशी खात्री बाळगली होती. परंतु वजन काट्यावर वजन करताच महिन्याभरापूर्वी ज्या वजन काट्याने त्यांचे वजन एकशे एक्याऐंशी पौंड दाखवले होते त्याच वजन काट्याने त्यांचे वजन आज एकशे व्याण्णव पौंड दाखवले. शिवाय ‘आप बहुत समझदार और गंभीर है।’ असे भविष्यही दाखवले. पंत एकीकडे पौष्टिक सात्त्विक आहार घेतात. लिंबाचा रस, फलाहार, दूध व दुसरीकडे पंधरा दिवसात चार वेळा भात खाऊन तो अपवाद समजतात आणि वजन कमी झाले असेल अशी खात्री बाळगतात, हा विनोद मला सर्वांत जास्त आवडला.
(ई) तुम्ही एखादा संकल्प केला आणि तो पूर्ण केला नाही तर कुटुंबातील व्यक्ती कोणत्या प्रतिक्रिया व्यक्त करतील, याची कल्पना करून लिहा.
उत्तरः
नववीची परीक्षा झाली व मी पास होऊन दहावीच्या वर्गात गेले. यावर्षी काहीही करून सकाळी लवकर उठून अभ्यास करायचा असा मी संकल्प केला. नुकतीच मे महिन्याची सुट्टी अनुभवलेली असल्यामुळे लवकर उठायची सवय मोडली होती. आईला मी माझ्या संकल्पाविषयी सांगितले. दुसऱ्या दिवसापासून आईने मला सकाळी पाच वाजता उठवायला सुरुवात केली. पहिल्या दिवशी नवा उत्साह असल्यामुळे मी शहाण्या बाळासारखी उठून बसले.
शाळा सुरू झाल्यानंतर सुरुवातीला मैत्रिणीबरोबरच्या गप्पा, खेळ, शाळेतील अभ्यास या सर्वांमुळे मला माझ्या संकल्पाविषयी विसर पडू लागला. इतरांबरोबर मजा करणे कमी झाले. कोणतीही गोष्ट करताना मी यंदा दहावीत आहे याची जाणीव करून दिली जाई. सकाळी लवकर उठून अभ्यास करण्याचा माझा संकल्प आई विसरली नव्हती. आईनेच एकदा घरातील सर्वांच्या देखत माझी चेष्टा केली, घरातील लहान भावंडेही माझी मस्करी करू लागली. खेळणे, टि.व्ही. पाहणे हे सारेच मला पारखे झाले. मग मात्र मी निश्चय केला, की आपण कुणाच्याच चेष्टेचा विषय बनू नये, मी केलेला संकल्प पूर्ण करण्यासाठी मनाची तयारी केली व नियमित लवकर उठून अभ्यास नियमित करू लागले.
![]()
Marathi Akshar Bharati Class 10 Textbook Solutions Chapter 4 उपास Additional Important Questions and Answers
प्रश्न १. पुढील उताऱ्याच्या आधारे दिलेल्या सूचनेनुसार कृती करा.
कृती १: आकलन कृती
प्रश्न 1.
आकृतिबंध पूर्ण करा.
उत्तर:
प्रश्न 2.
काय ते लिहा.
उत्तर:
(i) पंतांची चाळीत जाहीर झालेली गोष्ट – [खाजगी उपोषण]
(ii) पंतांच्या डोळ्यांपुढे रात्रंदिवस नाचत होते – [एकशे एक्क्याऐंशी पौंड वजन असलेले कार्ड]
प्रश्न 3.
एका वाक्यात उत्तरे लिहा.
(i) पंतांनी कोणती भीष्मप्रतिज्ञा केली?
उत्तर:
“दोन महिन्यात पन्नास पौंड वजन कमी करून दाखवीन तर खरा!” अशी भीष्मप्रतिज्ञा पंतांनी केली होती.
![]()
(ii) कोणत्या विचाराने पंतांची झोप उडाली?
उत्तर:
वजन कमी झाले पाहिजे, या विचाराने पंतांची झोप उडाली.
(iii) पंतांच्या धर्मपत्नीचा कशावर अजिबात विश्वास नव्हता?
उत्तर:
पंत पूर्वीसारखे गाढ झोपत नाहीत यावर त्यांच्या धर्मपत्नीचा अजिबात विश्वास नव्हता.
(iv) पंतांना ताटातले पदार्थ न दिसता काय दिसू लागल्या?
उत्तर:
पंतांना ताटातले पदार्थ न दिसता नुसत्या ‘कॅलरीज’ दिसू लागल्या. उताऱ्यानुसार घटनांचा क्रम लावा. वजन उतरवण्याच्या शास्त्रात पारंगत झालेले तज्ज्ञ पंतांना भेटू लागले. चाळीतल्या लोकांनी पंतांच्या उपासाची अवहेलना केली. पंतांच्या खाजगी उपोषणाची हकीकत चाळीत जाहीर झाली.
(iv) पंतांनी दोन महिन्यात पन्नास पौंड वजन कमी करून दाखवीन अशी भीष्मप्रतिज्ञा केली.
उत्तर:
(i) पंतांच्या खाजगी उपोषणाची हकीकत चाळीत जाहीर झाली.
(ii) पंतांनी दोन महिन्यात पन्नास पौंड वजन कमी करून दाखवीन! अशी भीष्मप्रतिज्ञा केली.
(iii) वजन उतरवण्याच्या शास्त्रात पारंगत झालेले तज्ज्ञ पंतांना भेटू लागले.
(iv) चाळीतल्या लोकांनी पंतांच्या उपासाची अवहेलना केली.
कृती २ : आकलन कृती
प्रश्न 1.
उत्तरे लिहा.
उत्तर:
(i) पंतांचे वजन – [एकशे एक्क्याऐंशी पौंड]
(ii) चाळीतल्या लोकांनी पंतांना दिलेला सल्ला – [डाएटचा]
![]()
प्रश्न 2.
खालील शब्द मराठीत स्पष्ट करा.
उत्तर:
(i) डाएट – नेहमीचा आहार (आहारावर निबंध)
(ii) प्रोटीन – दूध, अंडी, मांस इ. मधील पोषक द्रव्य
(iii) कॅलरी – अन्नापासून मिळणाऱ्या शक्तीचे (ऊर्जेचे) प्रमाण
(iv) पौंड – वजनाचे एक माप
प्रश्न 3.
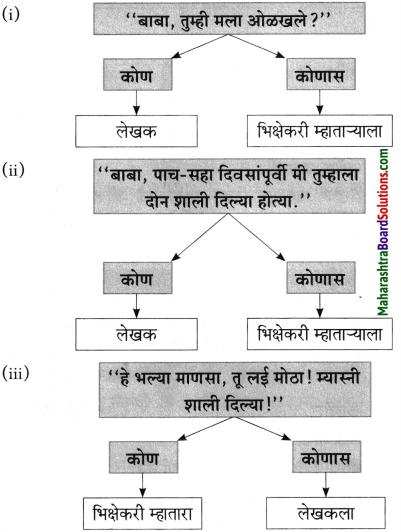
कोण कोणास म्हणाले ते लिहा.
उत्तर:
प्रश्न 4.
कोण ते लिहा.
उत्तर:
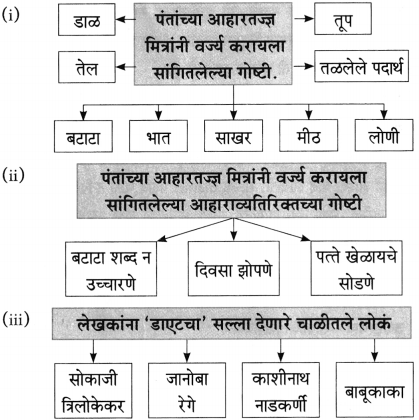
(i) डाएटचा सल्ला देणारी चाळीतील व्यक्ती – [सोकाजी त्रिलोकेकर]
(ii) पंतांना दुरुत्तरे करणारी – [पंतांची धर्मपत्नी]
प्रश्न 5.
चूक की बरोबर ते लिहा.
(i) चाळीतल्या लोकांनी पंतांच्या उपासाची अवहेलना केली.
(ii) प्रोटीनयुक्त पदार्थ, चरबीयुक्त पदार्थ पंत खाऊ लागले.
(iii) वजन कमी झाले पाहिजे, या विचाराने पंतांची झोप उडाली.
(iv) आहार शास्त्रातील तज्ज्ञ व्यक्तींना पंत भेटत नव्हते.
उत्तर:
(i) बरोबर
(ii) चूक
(iii) बरोबर
(iv) चूक
![]()
प्रश्न 6.
कंसातील योग्य शब्द वापरून रिकाम्या जागा भरा.
(i) रात्रंदिवस ते ………………………….. माझ्या डोळ्यांपुढे नाचत होते. (कार्ड, दिवस, वजन, घड्याळ)
(ii) आमच्या चाळीतल्या लोकांनी माझ्या उपासाची ………………………….. केली होती. (टिंगल, चेष्टा, मस्करी, अवहेलना)
उत्तर:
(i) कार्ड
(ii) अवहेलना
कृती ३ : स्वमत
प्रश्न 1.
पंतांनी भीष्मप्रतिज्ञा करण्यामागचा हेतू लिहा.
उत्तरः
पंतांनी उपोषण केल्याची खाजगी हकीकत चाळीत जाहीर झाली आणि येताजाता ‘नाही ती भानगड आहे’, ‘उगीच हात दाखवून अवलक्षण’ आहे, ‘पेललं नाही तेव्हा खाजगी झालं!’ अशी वाक्ये त्यांच्या कानावर पडू लागली. पंतांना मात्र रात्रांदिवस ‘एकशे एक्क्याऐंशी पौंड’ वजनाचे कार्ड डोळ्यांपुढे नाचत होते. वजन कमी झाले पाहिजे या विचाराने त्यांची झोप उडाली. झोप कमी झाल्यामुळे वजन कमी होते या विचाराने त्यांना त्याचे काही वाटत नव्हते. पण यावर पत्नीचे दुरुत्तर होते की “घोरत तर असता रात्रभर!” एकूण काय वजन कमी झाले पाहिजे या विचाराने पंतांनी “दोन महिन्यात पन्नास पौंड वजन कमी करून दाखवीन तर खरा!” अशी भीष्मप्रतिज्ञा केली.
प्रश्न 2.
‘चाळ संस्कृती’ चे पाठातून होणारे दर्शन स्पष्ट करा.
उत्तरः
पंत म्हणजे लेखक पु. ल. देशपांडे होत. ते चाळीत राहत असतानाचे वर्णन त्यांनी पाठात केले आहे. यासोबत चाळीतील लोकांचे स्वभाव, चाळीतील लोकजीवन यांची ओळख करून दिली आहे.
चाळ संस्कृतीत लोकांच्या वागण्यातील मोकळेपणा पाठातून दिसून येतो. एकमेकांना नावे ठेवली तरी मनात एकमेकांबद्दल प्रेम असते. कोणतीही गोष्ट चाळीत लपून राहत नाही. ही चाळ संस्कृतीची वैशिष्ट्ये पाठात दिसून येतात.
प्रश्न २. खालील उताऱ्याच्या आधारे दिलेल्या सूचनेनुसार कृती करा:
कृती १: आकलन कृती
प्रश्न 1.
खालील कृती पूर्ण करा.
उत्तर:
![]()
प्रश्न 2.
एका वाक्यात उत्तरे लिहा.
(i) काशीनाथ नाडकर्णीनी पंतांना कोणती गोष्ट वर्ण्य करायला सांगितली?
उत्तर:
काशीनाथ नाडकर्णीनी पंतांना डाळ वर्ण्य करायला सांगितली.
(ii) बाबूकाकांनी कोणत्या गोष्टी सोडावयास सांगितले?
उत्तरः
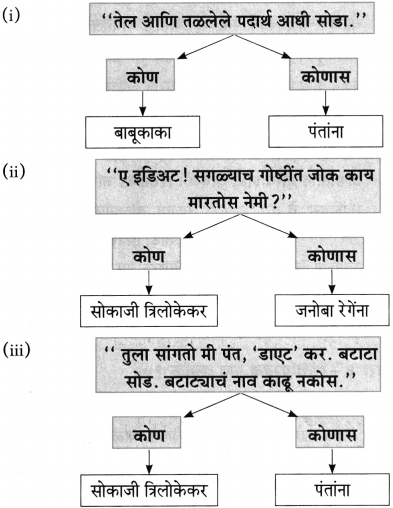
बाबूकाकांनी तेल आणि तळलेले पदार्थ सोडावयास सांगितले.
(iii) बसून बसून काय खेळल्याने वजन वाढते?
उत्तरः
बसून बसून पत्ते खेळल्याने वजन वाढते.
(iv) “ए इडिअट! सगळ्याच गोष्टींत जोक काय मारतोस नेमी?” असे जनोबा रेगेंना कोण म्हणाले?
उत्तरः
“ए इडिअट! सगळ्याच गोष्टींत जोक काय मारतोस नेमी” असे जनोबा रेगेंना, सोकाजी त्रिलोकेकर म्हणाले.
प्रश्न 3.
कोण ते लिहा.
उत्तर:
(i) नेहमी तिरके बोलणारे → जनोबा रेगे
(ii) सर्व जनांचे ऐकून मनाचे करायचे ठरवणारे → पंत
(iii) ‘बटाट्याची चाळ’ म्हणू नका. वजन वाढेल! असे उपदेश करणारे → जनोबा रेगे
(iv) या ठिकाणी सगळे भात खातात
प्रश्न 4.
उताऱ्यानुसार वाक्यांचा क्रम लावा.
(i) पहिला उपाय म्हणून मी ‘आहारपरिवर्तन’ सुरू केले.
(ii) “तेल आणि तळलेले पदार्थ आधी सोडा.”
(iii) जनोबा रेगे या इसमाला काय म्हणावे हे मला कळत नाही.
(iv) “ए इडिअट! सगळ्याच गोष्टींत जोक काय मारतोस नेमी?
उत्तर:
(i) जनोबा रेगे या इसमाला काय म्हणावे हे मला कळत नाही.
(ii) “ए इडिअट! सगळ्याच गोष्टींत जोक काय मारतोस नेमी?
(iii) “तेल आणि तळलेले पदार्थ आधी सोडा.”
(iv) पहिला उपाय म्हणून मी ‘आहारपरिवर्तन’ सुरू केले.
![]()
कृती २ : आकलन कृती
प्रश्न 1.
कंसातील योग्य शब्द वापरून रिकाम्या जागा भरा.
(i) “मी सांगतो तुला पंत तू …………………………….. सोड”. (तेल, तूप, साखर, बटाटा)
(ii) आमच्या कोकणात सगळे …………………………….. खातात. (भाकरी, मासे, भात, भाजी)
(iii) “हो! ‘म्हणजे कुठं राहता?’ म्हणून विचारलं तर नुसतं …………………………….. राहतो’ म्हणा.” (रस्त्यावर, चाळीत, घरात, बंगल्यात)
(iv) “खरं म्हणजे पत्ते खेळायचं सोडा बसून बसून …………………………….. वाढतं.” (पोट, वजन, हाड, झोप)
उत्तर:
(i) बटाटा
(ii) भात
(ii) चाळीत
(iv) वजन
प्रश्न 2.
कोण कोणास म्हणाले?
उत्तर:
![]()
प्रश्न 3.
कारणे लिहा.
(i) पंतांना दिवसा झोपणं आणि पत्ते खेळणं सोडावयास सांगितले.
उत्तर:
दिवसा झोपण्यामुळे व पत्ते खेळण्यानं बसून बसून वजन वाढते म्हणून दिवसा झोपणं व पत्ते खेळणं सोडावयास सांगितले.
(ii) पंतांना लोणी-तूप सोडा असे सांगितले.
उत्तर:
पंतांना लोणी-तूप सोडा असे सांगितले कारण त्यांच्या हेडक्लार्कच्या वाईफचं वजन लोणी-तूप सोडल्यानं एका आठवड्यात दहा पौंड घटलं होतं म्हणून त्यांनी हा सल्ला दिला.
कृती ३ : स्वमत
प्रश्न 1.
पंतांना कोणाचा सल्ला तिरकेपणाचा वाटला तुमच्या शब्दांत लिहा.
उत्तर:
पंतांच्या चाळीतील सोकाजी त्रिलोकेकर यांनी पंतांना डाएटचा सल्ला दिला. पंतांना बटाटा सोडण्यास सांगितले. त्यावर जनाबा रेगे म्हणाले की, “हो! म्हणजे कुठं राहाता असं जरी विचारले तरी नुसतं ‘चाळीत राहतो’ असे म्हणायचे” ‘बटाट्याच्या चाळीत’ म्हणायचं नाही. वजन वाढेल. असे हे जनोबा रेगे यांचे बोलणे तिरकेपणाचे होते कारण बाकी सगळ्यांनी पंतांना खाण्याबाबत व त्यांच्या वजन वाढीस पूरक अशा सवयी सोडण्याबाबत सल्ले दिले होते, पण रेगे यांनी ‘बटाट्याची चाळ’ असे सुद्धा न म्हणता फक्त चाळच म्हणा असा तिरकस सल्ला पंतांना दिला.
प्रश्न ३. खालील उताऱ्याच्या आधारे दिलेल्या सूचनेनुसार कृती करा:
कृती १ : आकलन कृती
प्रश्न 1.
आकृतिबंध पूर्ण करा.
उत्तर:
![]()
प्रश्न 2.
कोण ते लिहा.
उत्तर:
(i) डाएटवर सूड घेणारा → कैंटीनचा आचारी
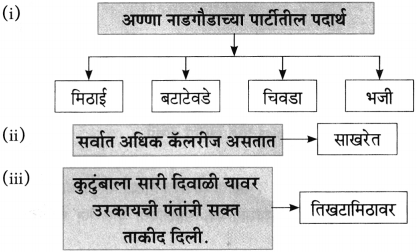
कचेरीतील साऱ्या सेक्शनला पार्टी देणारा → अण्णा नाडगौडा
प्रश्न 3.
एका वाक्यात उत्तरे लिहा.
(i) व्रतभंगाचा प्रसंग केव्हा आला?
उत्तरः
व्रतभंगाचा प्रसंग दुसऱ्या दिवशी म्हणजे अण्णा नाडगौडाच्या पार्टीच्या दिवशी आला.
(ii) पंतांना डाएटवर असल्याची आठवण केव्हा झाली?
उत्तरः
भज्यांची सहावी प्लेट खाल्ल्यावर पंतांना डाएटवर असल्याची आठवण झाली.
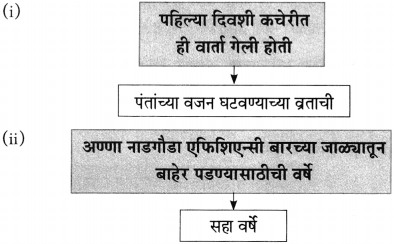
(iii) पंतांच्या वजन घटवण्याच्या व्रताची वार्ता पहिल्या दिवशी कोठे गेली होती?
उत्तर:
पंतांच्या वजन घटवण्याच्या व्रताची वार्ता पहिल्या दिवशी कचेरीला गेली होती.
प्रश्न 4.
कारणे लिहा.
(i) पंतांनी बिन साखरेचा चहा सुरू केला.
उत्तर:
साखरेत सर्वांत अधिक कॅलरीज असतात, म्हणून बिनसाखरेचा चहा पंतांनी सुरू केला.
(ii) पंतांनी फक्त मधला भात वर्ण केला.
उत्तरः
वजन कमी करायचे तर पंतांना भात पूर्णपणे सोडावा लागणार होता परंतु भात अजिबात वर्ण्य करणे अवघड होते म्हणून पंतांनी फक्त पहिला भात आणि ताकभात ठेवून मधला भात वर्ण्य केला.
कृती २ : आकलन कृती
प्रश्न 1.
आकृतिबंध पूर्ण करा.
उत्तर:
![]()
प्रश्न 2.
कारणे लिहा.
(i) पंतांना खाल्लेले गोड लागत नव्हते.
उत्तरः
पंतांना खाल्लेले गोड लागत नव्हते, कारण आचाऱ्याने मिठाईत साखर न घालता साखरेत मिठाई घालून आणली होती. त्यामुळे घासा-घासागणिक सहस्रावधी कॅलरीज पोटात जात होत्या.
(ii) नाडगौडाने स्पेशल भज्यांची ऑर्डर दिली.
उत्तरः
नाडगौडाने स्पेशल भज्यांची ऑर्डर दिली कारण भज्यांशिवाय पार्टी कसली?’ असा भिकोबा मुसळ्याने टोमणा दिला, म्हणून चेकाळून नाडगौडाने स्पेशल भज्यांची ऑर्डर दिली.
प्रश्न 3.
कंसातील योग्य पर्याय निवडून रिकाम्या जागा भरा.
(i) कुटुंबाला सारी …………………………….. तिखटामिठावर उरकायची सक्त ताकीद दिली. (संक्रांत, दिवाळी, गुढीपाडवा, होळी)
(ii) चिवडा अस्सल …………………………….. तला, त्यामुळे आणखी कॅलरीज, (‘तूप’, ‘तेला’, ‘वनस्पती’, ‘साखरेत’)
उत्तर:
(i) दिवाळी
(ii) ‘वनस्पती’
प्रश्न 4.
सहसंबंध लिहा.
(i) चहा : बिनसाखरेचा : भाजी : ……………………………..
(ii) भजी : स्पेशल : चिवडा : ……………………………..
उत्तर:
(i) उकडलेली
(ii) अस्सल
प्रश्न 5.
चूक की बरोबर लिहा.
(i) ‘सध्या मी ‘डाएट’ वर असल्याचे सांगितल्यावर पंतांना सर्वांनी वेड्यात काढले.
(ii) साखरेत सर्वात अधिक कॅलरीज नसतात.
उत्तर:
(i) बरोबर
(ii) चूक
कृती ३ : स्वमत
प्रश्न 1.
पंतांची ‘साखरबंदी’ वर्णन करा.
उत्तरः
पंतांनी आहारपरिवर्तन सुरू केल्यानंतर साखरेत सर्वांत अधिक कॅलरीज असतात; म्हणून प्रथम बिनसाखरेचा चहा सुरू केला. घरात साखरबंदी जाहीर केली. कुटुंबाला सारी दिवाळी तिखटमिठावर उरकायची सक्त ताकीद दिली. मुलांसाठीच फक्त गोडाधोडाचं करण्याची सवलत ठेवली.
![]()
प्रश्न 2.
नाडगौडाला वाईट वाटू नये म्हणून पंतांनी काय केले?
उत्तरः
पंतांच्या व्रताचा पहिला दिवस सुरळीत पार पडला. दुसऱ्या दिवशी मात्र व्रतभंगाचा प्रसंग आला. अण्णा नाडगौडाला प्रमोशन मिळाले; म्हणून त्याने साऱ्या सेक्शनला पार्टी दिली. कँटीनच्या आचाऱ्याने पंतांच्या डाएटवर सूड घ्यायचा असे ठरवून पदार्थ केले होते; पण न खावे तर अण्णा नाडगौडाला वाईट वाटेल; कारण सहा वर्षांनी तो ‘एफिशिएन्सी बार’ च्या जाळ्यातून बाहेर पडला होता. पंतांनी नाडगौडाला वाईट वाटू नये म्हणून, स्वतः ‘डाएट’ वर असतानासुद्धा सर्व पदार्थ भरपूर खाल्ले.
प्रश्न 3.
पत्नीने केलेल्या भाजीची पंत कशी खिल्ली उडवतात?
उत्तरः
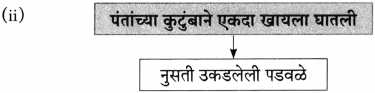
पंतांनी आहारपरिवर्तन सुरू केल्यावर नुसती उकडलेली पालेभाजी खाणे कसे जमणार हा विचार पोकळ होता. त्याचा अनुभव ती खाल्ल्यावर आला आणि नेहमीच्या भाजीत आणखी वेगळे काय करते याचा कधी अंदाज आला नाही. म्हणजे एक तर पत्नीने केलेली भाजी बेचव असू शकते अथवा पत्नीने फसवून नेहमीसारखी न उकडता दिलेली असावी; पण पंत मात्र केलेल्या भाजीला नाव ठेवतात. पंत आपल्या पत्नीला नेहमीच्या भाजीत ‘ही’ निराळे काय करते याचा अजूनही अंदाज आला नाही, असा उपरोधिक टोमणा देऊन भाजीची खिल्ली उडवतात.
प्रश्न 4.
‘सध्या मी ‘डाएट’ वर असल्याचे सांगितल्यावर सर्वांनी पंतांना वेड्यात काढले’, स्पष्ट करा.
उत्तरः
पंतांनी व्रत सुरू केले आणि दुसऱ्याच दिवशी अण्णा नाडगौडाच्या प्रमोशनची पार्टी होती. नाडगौडाला वाईट वाटू नये म्हणून पंतांनी पार्टीतील पदार्थ खाल्ले. आचाऱ्याने मिठाईत साखर न घालता साखरेत मिठाई घालून आणली होती. वनस्पती तूपातला चिवडा, बटाटेवडे एवढे सगळे असूनही शेवटी भज्यांशिवाय पार्टी कसली म्हणून भजीही होती. एवढ्या सगळ्यातून सहस्त्रावधी कॅलरीज पोटात चालल्या होत्या. भजीची सहावी प्लेट खाल्ल्यावर पंतांनी आपण डाएटवर असल्याचे केविलवाण्या स्वरात सांगितले, म्हणून सर्वांनी पंतांना वेड्यात काढले.
प्रश्न ४. पुढील उताऱ्याच्या आधारे दिलेल्या सूचनेनुसार कृती करा,
कृती १: आकलन कृती
प्रश्न 1.
आकृतिबंध पूर्ण करा.
उत्तर:
![]()
प्रश्न 2.
एका वाक्यात उत्तरे लिहा.
(i) जगदाळेंनी कोणता सल्ला दिला?
उत्तरः
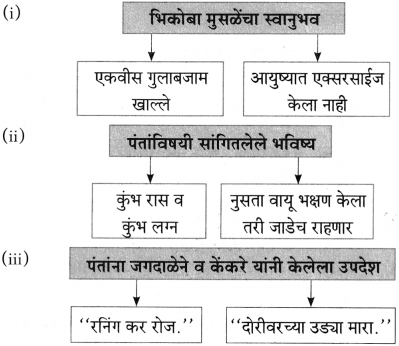
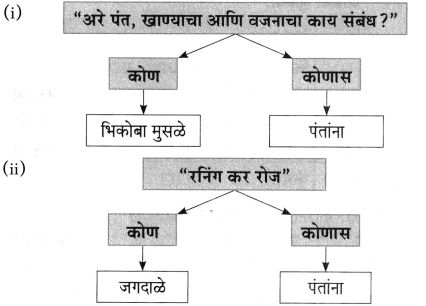
पंतांना जगदाळेंनी रनिंग करण्याचा सल्ला दिला.
(ii) कु. कमलिनी केंकरेंनी पंतांना कोणता सल्ला दिला?
उत्तर:
कु. कमलिनी केंकरेंनी पंतांना दोरीवरच्या उड्या मारण्याचा सल्ला दिला.
(iii) पंतांना यापूर्वी कधीच कोणती कल्पना आली नव्हती?
उत्तर:
बिनसाखरेचा चहा इतका कडू लागत असेल अशी यापूर्वी पंतांना कधीच कल्पना आली नव्हती.
प्रश्न 3.
कोण कोणास म्हणाले.
उत्तर:
प्रश्न 4.
कंसातील योग्य पर्याय निवडून रिकाम्या जागा भरा.
(i) कुटुंबाचा मात्र माझ्या ‘डाएटच्या’ बाबतीतला उत्साह होता. (जेवढ्यासतेवढा, अवर्णनीय, वर्णनीय, खूप)
(ii) रोज काही काही ……………………. पदार्थ माझ्या पानात पडायला लागले. (चविष्ट, खास, आवडते, चमत्कारिक)
उत्तर:
(i) अवर्णनीय
(ii) चमत्कारिक
कृती २: आकलन कृती
प्रश्न 1.
आकृतिबंध पूर्ण करा.
उत्तर:
![]()
प्रश्न 2.
काय ते लिहा.
उत्तर:
प्रश्न 3.
खालील विधाने चूक की बरोबर ते लिहा.
(i) शेवटी सर्वांच्या मते मी सकाळी पोहावे असे ठरले.
(ii) सकाळचा चहा देखील सुरुवातीला होता तसा राहिला नाही.
(iii) सडपातळ भाज्यांची स्वयंपाकघरातून हकालपट्टी झाली.
(iv) बाळसेदार भाज्यांचा खुराक चालू झाला.
उत्तर:
(i) चूक
(ii) बरोबर
(iii) चूक
(iv) चूक
प्रश्न 4.
जोड्या जुळवा.
उत्तर:
(i-आ),
(ii – इ),
(iii – अ),
(iv – ई)
कृती ३: स्वमत
प्रश्न 1.
भिकोबा मुसळेने पंतांचे कसे समर्थन केले?
उत्तरः
पंतांनी वजन कमी करण्यासाठी ‘डाएट’ सुरू केले होते. परंतु अण्णा नाडगौडाच्या पार्टीत सहा प्लेट भजी खाऊन सातवी प्लेट झाल्यावर त्यांना आपण सध्या डाएटवर असल्याची आठवण होते. तेव्हा भिकोबा मुसळे पंतांचे समर्थन करतात, की खाण्याचा आणि वजनाचा काय संबंध? ‘मी बघ एकवीस गुलाबजाम खाल्ले. एवढंच काय, आपण तर आयुष्यात एक्सरसाईज नाही केला. तुझी कुंभ रास नि कुंभ लग्न आहे. नुसता वायू भक्षण करून राहिलास तरी असाच जाड्या राहणार. तेव्हा थोडक्यात खाण्यावर बंधन ठेवण्याचे कारण नाही, असे भिकोबांना सांगायचे होते.
![]()
प्रश्न 2.
बिनसाखरेचा चहा कडू लागतो हे पंतांच्या केव्हा लक्षात आले?
उत्तरः
पंतांनी डाएट सुरू केल्यापासून त्यांच्या धर्मपत्नीचा उत्साह अवर्णनीय होता. रोज चमत्कारिक पदार्थ त्यांच्या पानात पडू लागले. बाळसेदार भाज्यांची स्वयंपाक घरातून हकालपट्टी केली व सडपातळ भाज्यांचा खुराक सुरू केला. सकाळचा चहा देखील सुरुवातीला होता तसा राहिला नाही. बिनसाखरेचा चहा इतका कडू लागत असेल याची पंतांना कधीच कल्पना आली नाही. पत्नीला यासंबंधी विचारले असता कुटुंबाने खुलासा केला की सुरुवातीचा चहा बिनसाखरेचा नव्हताच मुळी. त्यानंतर पंतांना समजले की बिनसारखेचा चहा कडू लागतो.
प्रश्न 3.
‘बाळसेदार भाज्यांची स्वयंपाकघरातून हकालपट्टी झाली’. स्पष्ट करा.
उत्तरः
पंतांचे डाएट सुरू झाल्यानंतर कुटुंबाचा उत्साह वर्णन करता न येण्यासारखा होता. रोज चमत्कारिक पदार्थ पंतांच्या ताटात पडू लागले. सडपातळ भाज्या शेवग्याच्या शेंगा, पडवळ, भेंडी, चवळीच्या शेंगा यांचा खुराक सुरू केला. पंतांचे वजन कमी व्हावे म्हणून बाळसेदार भाज्या कोबी, कॉलिफ्लॉवरची स्वयंपाक घरातून हकालपट्टी केली.
प्रश्न ५. पुढील उताऱ्याच्या आधारे दिलेल्या सूचनेनुसार कृती करा.
कृती १: आकलन कृती
प्रश्न 1.
कारणे लिहा.
(i) पंतांना सुरुवातीला चहा बिनसाखरेचा असूनही कडू लागला नाही.
उत्तर:
पंतांना सुरुवातीला चहा बिनसाखरेचा असूनही कडू लागला नाही कारण तो बिनसाखरेचा नव्हता म्हणून.
(ii) पंतांना बिनसाखरेचा चहा धर्मपत्नीने दिला नाही.
उत्तर:
पंतांना बिनसाखरेचा चहा न देण्याचे कारण घरात थोडीशीच साखर होती. ती संपेपर्यंत धर्मपत्नीने साखरेचा चहा दयायचे ठरवले.
प्रश्न 2.
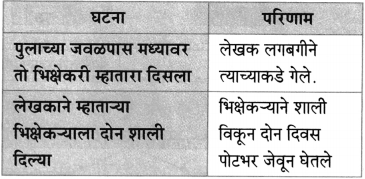
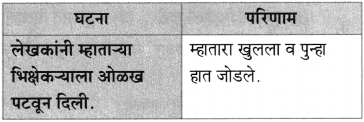
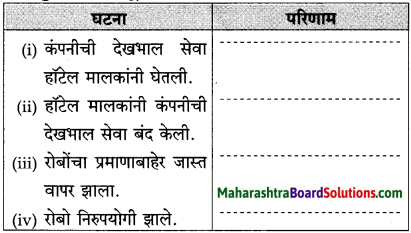
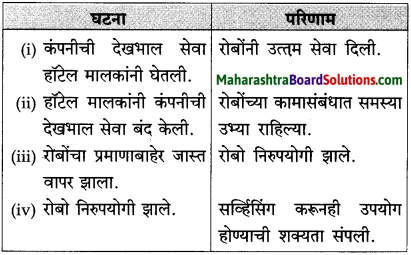
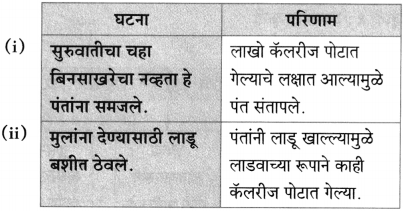
पुढील घटनांचे परिणाम लिहा.
उत्तर:
![]()
प्रश्न 3.
उत्तर:
प्रश्न 4.
उताऱ्यानुसार वाक्यांचा क्रम लावा.
(i) “इश्श! साखरेशिवाय लाडू आमच्या नाही घराण्यात केले कुणी!”
(ii) “उगीच आरडाओरडा नका करू.”
(iii) “चहा सुरुवातीला बिनासाखरेचा असूनही कडू लागला नाही.”
(iv) कसलं कमी होतंय माझं वजन?
उत्तर:
(i) “चहा सुरुवातीला बिनासाखरेचा असूनही कडू लागला नाही.”
(ii) कसलं कमी होतंय माझं वजन?
(iii) “उगीच आरडाओरडा नका करू.”
(iv) “इश्श! साखरेशिवाय लाडू आमच्या नाही घराण्यात केले कुणी!”
कृती २ : आकलन कृती.
प्रश्न 1.
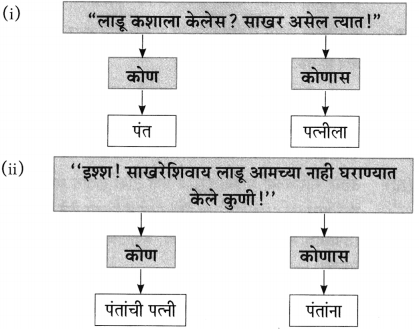
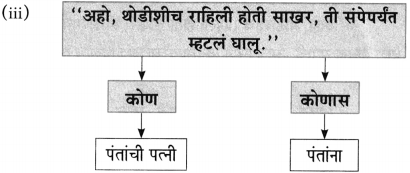
कोण कोणास म्हणाले?
उत्तर:
![]()
प्रश्न 2.
कंसातील योग्य पर्याय निवडून रिकाम्या जागा भरा.
(i) चहा सुरुवातीला बिनसाखरेचा असूनही …………………………….. लागला नाही. (गोड, कडू, खारट, आंबट)
(ii) ‘साखरेशिवाय …………………………….. आमच्या नाही घराण्यात केले कुणी! (लाडू, पेढे, वड्या, बर्फी)
उत्तर:
(i) कडू
(ii) लाडू
प्रश्न 3.
चूक की बरोबर ते लिहा.
(i) लाडवाच्या रूपाने काही कॅलरीज पोटात गेल्याच!
(ii) लाडू बशीत ठेवून कुटुंबाने पंताच्या वजनक्षय – संकल्पाला मदत केली.
(iii) सुरुवातीला दिलेला चहा बिनसाखरेचा होता,
उत्तर:
(i) बरोबर
(ii) चूक
(iii) चूक
प्रश्न 4.
घटना क्रमानुसार लिहा.
(i) पंतांच्या वजनक्षय संकल्पाला नवे सुरुंग लावणारे कुटुंबाचे उद्गार
(ii) चहा सुरुवातीला बिनसाखरेचा असूनही कडू लागला नाही.
(iii) चहा बिनसाखरेचा नव्हता याचा खुलासा झाला.
(iv) बिनसाखरेचा चहातील साखरेची उणीव लाडू खाऊन भरून काढली.
उत्तर:
(i) चहा सुरुवातीला बिनसाखरेचा असूनही कडू लागला नाही.
(ii) चहा बिनसाखरेचा नव्हता याचा खुलासा झाला.
(iii) पंतांच्या वजनक्षय – संकल्पाला नवे सुरुंग लावणारे कुटुंबाचे उद्गार
(iv) बिनसाखरेच्या चहातील साखरेची उणीव लाडू खाऊन भरून काढली.
प्रश्न ६. पुढील उताऱ्याच्या आधारे दिलेल्या सूचनेनुसार कृती करा.
कृती १: आकलन कृती
प्रश्न 1.
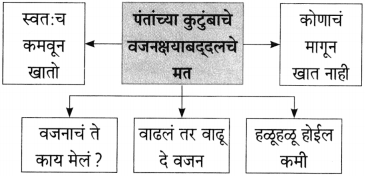
आकृती पूर्ण करा.
उत्तर:
![]()
प्रश्न 2.
उत्तरे लिहा.
(i) आचार्य बाबा बर्वेनी पंतांना कोणते सल्ले दिले?
उत्तरः
पंतांचे वजन कमी करण्यासाठी आचार्य बाबा बर्वेनी जिभेवर ताबा ठेवा, संयम राखा, मनाची एकाग्रता ठेवा, बोलणे सोडा, असे सल्ले दिले.
(ii) आचार्य बाबा बर्वेनी पंतांना क्षमा केली.
उत्तरः
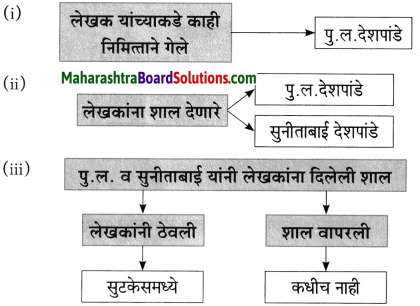
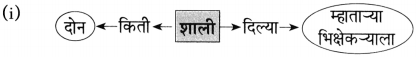
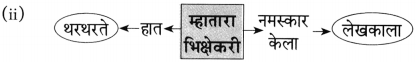
पंतांच्या दोरी उड्या मारण्याच्या सरावातील दुसरी उडी मारताना बाबा बर्वेच्या गळ्यात दोरी पडली. यावर बर्वे खूप संतापले व पंतांना म्हणाले, ‘हा दुष्टपणा माझ्या गळ्यात दोरी अडकवून केलात हे ठीक झालं, पण तुमच्या वयाला न शोभणाऱ्या या धिंगामस्तीला दुसरा कोणी माझ्यासारखं बळी पडला असता, तर धडगत नव्हती.’ आणि बर्वेनी पंतांना माफ केले.
प्रश्न 3.
कंसांतील योग्य पर्याय निवडून वाक्ये पूर्ण करा.
(i) मौन ही एक …………………………… आहे. (शक्ती, भक्ती, मुक्ती, उक्ती)
(ii) ‘आता या उड्या मारायला मी …………………………… देखील सोडली.’ (खाज, माज, लाज, व्याज)
(iii) उड्या मारायच्या माझ्या दोरीचे एक टोक हातात धरून बाबा एक तास …………………………… या विषयावर बडबडत होते. (उपासाचे महत्त्व, मौनाचं महत्त्व, वजनाचे महत्त्व, संसाराचे महत्त्व)
उत्तर:
(i) शक्ती
(ii) लाज
(iii) मौनाचं महत्त्व
प्रश्न 4.
का ते लिहा.
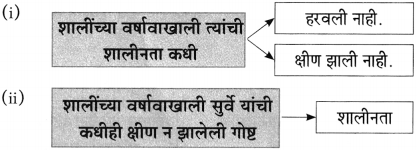
(i) पंत बोलणं सोडू शकत नव्हते.
उत्तरः
पंत टेलिफोन – ऑपरेटर असल्यामुळे त्यांना दिवसभर बोलावे लागत असे. न बोलता ते त्यांची नोकरी करू शकणार नव्हते. नोकरी नसेल तर पोटापाण्याचे काय? म्हणून पंत बोलणं सोडू शकत नव्हते.
(ii) पंतांना पश्चात्ताप झाला.
उत्तर:
आचार्य बाबा बर्वेना पंतांच्या वजन घटवण्याची वार्ता समजली, तेव्हा त्यांनी पंतांना वेगवेगळे सल्ले दिले. एक तास मौनाच्या सामर्थ्यावर बोलले. पंतांना मात्र मौन पाळणे शक्य नव्हते. तेव्हा वजन घटणे शक्य नसल्याचे सांगत कारुण्यपूर्वक कटाक्ष टाकत बाबा गेले. तेव्हां पंतांना वाटले की मघाशी बाबांच्या गळ्यात दोरी पडली ती गच्च आवळली का नाही, या विचाराने पंतांना पश्चात्ताप झाला.
![]()
कृती २: आकलन कृती
प्रश्न 1.
पुढील घटनांचे परिणाम लिहा.
उत्तर:
प्रश्न 2.
जोड्या जुळवा.
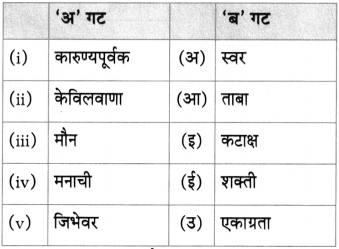
उत्तर:
(1 – इ),
(ii – अ),
(iii – ई),
(iv – उ)
(v – आ)
प्रश्न 3.
खालील विधाने चूक की बरोबर ते लिहा.
(i) मौनाचं सामर्थ्य मोठं नसते.
(ii) वजन वाढवण्यासाठी पंत दोरीच्या उड्या मारत होते.
(iii) पंतांच्या दिवाणखान्यात दोरी संपूर्ण फिरवणे अवघड होते.
(iv) पंतांच्या समाचाराला चाळीतली सारी मंडळी येऊन गेली.
उत्तर:
(i) चूक
(ii) चूक
(iii) बरोबर
(iv) बरोबर
![]()
प्रश्न 4.
कोण कोणास म्हणाले?
उत्तर:
प्रश्न 5.
एका वाक्यात उत्तरे लिहा.
(i) ‘मौनाचं महत्त्व’ या विषयावर कोण बडबडत होते?
उत्तर:
‘मौनाचं महत्त्व’ या विषयावर आचार्य बर्वे बडबडत होते.
(ii) पंत कोणती नोकरी करत होते?
उत्तर:
पंत टेलिफोन – ऑपरेटरची नोकरी करत होते.
प्रश्न 6.
उताऱ्यानुसार वाक्यांचा क्रम लावा.
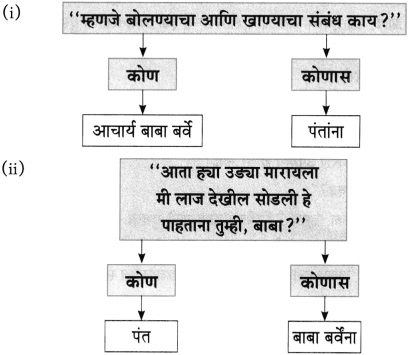
(i) “बोलण्याचा आणि खाण्याचा संबंध काय?”
(ii) जिभेवर ताबा नाही तुमचा.
(iii) “अहो वजन कमी करायला दोरीच्या उड्या मारतोय मी.”
(iv) ‘उपास’ हे त्यांचे खास राखीव कुरण होते.
उत्तर:
(i) ‘उपास’ हे त्यांचे खास राखीव कुरण होते.
(ii) “अहो वजन कमी करायला दोरीच्या उड्या मारतोय मी.”
(iii) जिभेवर ताबा नाही तुमचा.
(iv) “बोलण्याचा आणि खाण्याचा संबंध काय?”
कृती ३: स्वमत
प्रश्न 1.
आचार्य बाबा बर्वेची स्वभाव वैशिष्ट्ये लिहा.
उत्तरः
आचार्य बाबा बर्वे ही पंतांच्या शेजारच्या खोलीत राहणारी व्यक्ती होती. उपास हे त्यांचे खास कुरण होते. स्पष्टवक्तेपणाने पंतांना सांगणारे, दोरीवरच्या उड्या मारण्यावरून पंतांची कान उघडणी करणारे; पण माफ करणारे, मौनाचे महत्त्व जाणणारे, मौन या विषयावर बोलताना त्यांना स्वत:लाच बोलणे थांबवा असे सांगण्याची आवश्यकता असणारे, पंतांना बोलणं सोडण्याचा उपाय शक्य नाही हे पाहून कारुण्यपूर्ण नजरेने कटाक्ष टाकत ‘मग कसलं वजन उतरवणार तुम्ही.’ असं उघड उघड सांगणारे आचार्य बाबा बर्वे होते.
![]()
प्रश्न 2.
‘जिभेवर ताबा नाही तुमचा.’ या बोलण्यामागची भूमिका स्पष्ट करा.
उत्तरः
पंतांचा उपास सुरू झाल्याची हकीकत चाळीत पसरल्यावर लोक त्यांच्या समाचाराला येऊ लागली. प्रत्येकजण त्यांना वजन घटवण्यासाठी उपाय सुचवू लागला. कोणी खाण्यावर बंधन आणण्यासाठी सांगे तर कोणी शारीरिक व्यायामासाठी सांगे; पण आचार्य बनी मात्र जिभेवर बंधन घातले. म्हणजेच खाणे आणि बोलणे या दोन्ही गोष्टी संयमित हव्यात. जिभेचा जसा खाण्यासाठी उपयोग करतो, तसा बोलण्यासाठी उपयोग होतो. हे पंतांना प्रकर्षाने सांगू इच्छितात. त्यासाठी संयम हवा. मौन पाळले पाहिजे तरच वजन घटेल. अशी आचार्य बाबा बर्वेची बोलण्यामागची भूमिका होती.
प्रश्न ७. पुढील उताऱ्याच्या आधारे दिलेल्या सूचनेनुसार कृती करा.
कृती १: आकलन कृती.
प्रश्न 1.
आकृतिबंध पूर्ण करा.
उत्तर:
प्रश्न 2.
एका वाक्यात उत्तरे लिहा.
(i) पंतांच्या अंगाचा तिळपापड केव्हा होई?
उत्तर:
साखर पाहिली की पंतांच्या अंगाचा तिळपापड होई.
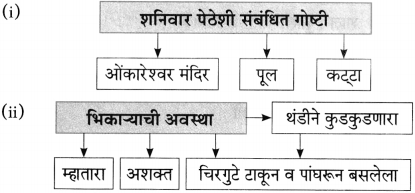
(ii) पंतांच्या दोरीवरच्या उड्या मारणे बंद का झाले?
उत्तर:
खालच्या मजल्यावरील मंडळींच्या दुष्टपणाने व आकसाने केलेल्या तक्रारींमुळे पंतांना दोरीवरच्या उड्या मारणे थांबवावे लागले.
(iii) पंतांनी कोणता आहार सुरू केला?
उत्तरः
केवळ पौष्टिक व सात्त्विक आहार पंतांनी सुरू केला.
![]()
प्रश्न 3.
उत्तरे लिहा.
(i) पंधरवडाभरात पंतांनी कोणते अपवाद वगळता भाताला स्पर्श केला नाही?
उत्तर:
पंधरवडाभरात फक्त दोन वेळाच साखरभात झाला.एकदा सोकाजीने चोरून कोळंबीभात चारला व खालच्या मजल्यावरच्या भाऊजी पसरटवारांनी एकदा नागपुरी वडाभात पाठवला होता. एवढे अपवाद वगळल्यास पंतांनी भाताला स्पर्श केला नाही.
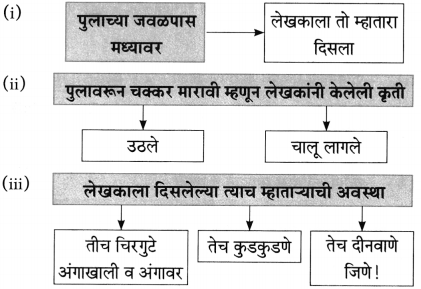
(ii) पंतांच्या आहारपरिवर्तनाचा परिणाम लिहा.
उत्तरः
पंतांनी आहारपरिवर्तन करून दहाबारा दिवस झाल्यावर त्यांच्यातला फरक त्यांनाच कळायला लागला. लहान मुले बी पेरले की रोप किती वाढले हे रोप उपटून पाहतात त्याप्रमाणे पंतांना रोज संध्याकाळी वजन काट्यावर वजन करावे असे वाटत होते.
प्रश्न 4.
कंसातील योग्य पर्याय निवडून रिकाम्या जागा भरा, मला मी ………………………… झाल्याची स्वप्ने पडू लागली. (जाडजूड, सडपातळ, काटकुळा, उंच)
(ii) ………………………… ताटावरून मी उठू लागलो. (रिकाम्या, सजवलेल्या, जेवलेल्या, भरल्या)
(iii) बिनसाखरेचा आणि बिनदुधाचाच काय; पण ” देखील चहा मी पिऊ लागलो. (पाण्याचा, दुधाचा, कॉफीचा, बिनचहाचा)
उत्तर:
(i) काटकुळा
(ii) भरल्या
(iii) बिनचहाचा
प्रश्न 5.
चूक की बरोबर ते लिहा.
(i) पंत केवळ फळांवर जगू लागले.
(ii) धारोष्ण दुधासाठी गिरगावातील गोठ्यात जाऊ लागले.
(iii) दोरीवरच्या उड्या मारण्यासाठी खालच्या मजल्यावरील मंडळींनी प्रोत्साहन दिले.
(iv) कचेरी सुटल्यावर पंत गिरगाव रस्त्याने धावत येऊ लागले.
उत्तर:
(i) बरोबर
(ii) चूक
(iii) चूक
(iv) बरोबर.
कृती २: आकलन कृती
प्रश्न 1.
कारणे लिहा.
(i) कचेरी सुटल्यावर, पंत गिरगाव रस्त्याने धावू लागले कारण …………………………
(अ) त्यांना घरी लवकर पोहोचायचे होते.
(आ) मित्रांबरोबर गप्पा मारायच्या होत्या.
(इ) फिरत फिरत पायी येऊन पैसे वाचवायचे होते.
(ई) त्यांना वजन कमी करायचे होते.
उत्तरः
कचेरी सुटल्यावर, पंत गिरगाव रस्त्याने धावू लागले कारण त्यांना वजन कमी करायचे होते.
![]()
(ii) लिंबाचा रस पंतांना अमृतासारखा वाटू लागला कारण …………………………
(अ) लिंब स्वस्त होती.
(आ) लिंब आवडत होती.
(इ) लिंबाच्या रसाने वजन कमी होते.
(ई) लिंबाचा सिझन होता.
उत्तर:
लिंबाचा रस पंतांना अमृतासारखा वाटू लागला कारण लिंबाच्या रसाने वजन कमी होते.
प्रश्न 2.
ओघतक्ता तयार करा.
उत्तर:
![]()
प्रश्न 3.
कसे ते लिहा.
उत्तर:
(i) लिंबाचा रस – अमृतासारखा
(ii) दूध – धारोष्ण
(iii) आहार – पौष्टिक आणि सात्त्विक
प्रश्न 4.
उताऱ्यानुसार वाक्यांचा क्रम लावा.
(i) मग मात्र मी चिडलो आणि निश्चय केला की बस्स.
(ii) लिंबाचा रस तर मला अमृतासारखा वाटू लागला.
(iii) मुख्यत: चरबी युक्त द्रव्ये शरीरात कमी गेली.
(iv) एकूण आहारव्रत जोरात चालू ठेवले.
उत्तर:
(i) मग मात्र मी चिडलो आणि निश्चय केला की बस्स.
(i) लिंबाचा रस तर मला अमृतासारखा वाटू लागला.
(iii) एकूण आहारव्रत जोरात चालू ठेवले.
(iv) मुख्यत: चरबी युक्त द्रव्ये शरीरात कमी गेली.
कृती ३: स्वमत
प्रश्न 1.
पंतांना भात अतिशय प्रिय होता, हे स्पष्ट करा.
उत्तरः
पंतांचे एकूण आहारव्रत जोरदार सुरू होते. केवळ पौष्टिक व सात्विक आहार दहाबारा दिवस चालू होता. त्यांच्यातील फरक त्यांनाच कळत होता. एक महिनाभर तुपाचा थेंब त्यांच्या पोटात जाणार नव्हता. केवळ दूध! असे असताना पंतांनी भात खाणे वर्ण्य केलेले असताना पंधरवडाभरात दोन वेळा साखरभात खाल्ला. एकदा सोकाजीने चोरून कोळंबीभात चारला व भाऊजी पसरवटांनी एकदा नागपुरी वडाभात पाठवला होता, एवढे अपवाद वगळता त्यांनी भाताला स्पर्श केला नाही. आहारव्रत सुरू असताना त्यांच्या समोर आलेल्या भाताचे प्रकार पाहून त्यांचा मोह आवरता आला नाही. यावरून पंतांना भात अतिशय प्रिय खादय होते हे स्पष्ट होते.
प्रश्न 2.
कचेरी सुटल्यावर पंत गिरगाव रस्त्याने धावू का लागले?
उत्तरः
पंतांचे वजन कमी करण्यासाठी त्यांच्या आहारतज्ज्ञ मित्रमंडळींनी विविध उपाय सांगितले.खाणे कमी करण्याबरोबरच शारीरिक व्यायाम व्हावा म्हणून दोरीच्या उड्या व रनिंग करावे असा सल्ला मिळाल्यामुळे पंत कचेरी सुटल्यावर गिरगाव रस्त्याने धावत घरी येऊ लागले.
![]()
प्रश्न 3.
पंतांनी उपास सुरू केल्यापासून त्यांनी केलेल्या कष्टाविषयी माहिती दया.
उत्तरः
पंतांनी वजन कमी व्हावे म्हणून उपासाचा निश्चय केला आणि आहारात बदल घडवून आणला. आहाराबरोबरच त्यांनी शारीरिक कष्टही घेतले. गाईचे दूध आणण्यासाठी ते अंधेरीच्या गोठ्यात जाऊ लागले. कचेरी सुटल्यावर गिरगाव रस्त्याने धावत येऊ लागले. दोरीवरच्या उड्या मारू लागले. या सर्व कष्टांच्या मागे त्यांना आपले वजन कमी व्हावे ही एकच अपेक्षा होती.
प्रश्न ८. पुढील उताऱ्याच्या आधारे दिलेल्या सूचनेनुसार कृती करा.
कृती १: आकलन कृती.
प्रश्न 1.
आकृतिबंध पूर्ण करा.
उत्तर:
प्रश्न 2.
कोण कोणास म्हणाले?
उत्तर:
![]()
प्रश्न 3.
कंसातील योग्य पर्याय निवडून रिकाम्या जागा भरा,
(i) मंडळींच्या प्रशस्तीने मला ……………………………. वाटत होती. (खात्री, वाईट, लाज, भीती)
(ii) छे, छे, वजनाचा मार्ग ……………………………. काट्यातून जातो. (नेहमीच्या, हलक्या, भलत्याच, लोखंडी)
(iii) हल्ली मी वजन आणि ……………………………. या दोन्ही गोष्टींची चिंता करायचे सोडून दिले आहे. (खाणे, पिणे, फिरणे, भविष्य)
उत्तर:
(i) भीती
(ii) भलत्याच
(iii) भविष्य
प्रश्न 4.
घटना क्रमानुसार लिहा.
(i) डाएटच्या आहारी या जन्मात न जाण्याचे ठरवले.
(ii) पंतांच्या डाएटची चेष्टा करणाऱ्यांनी प्रशंसा केली.
(iii) एकशे ब्याण्णव पौंड वजन दाखवले.
(iv) असामान्य मनोनिग्रह आणि जिव्हा नियंत्रण केले.
उत्तर:
(i) पंतांच्या डाएटची चेष्टा करणाऱ्यांनी प्रशंसा केली.
(ii) असामान्य मनोनिग्रह आणि जिव्हा नियंत्रण केले.
(iii) एकशे ब्याण्णव पौंड वजन दाखवले.
(iv) डाएटच्या आहारी या जन्मात न जाण्याचे ठरवले.
कृती २: आकलन कृती
प्रश्न 1.
आकृतिबंध पूर्ण करा.
उत्तर:
प्रश्न 2.
उत्तरे ते लिहा.
उत्तर:
(i) पंतांना खात्री होती – [वीस पंचवीस पौंडांनी वजन घटण्याची.]
(i) मंडळींच्या प्रशस्तीने पंतांना भीती वाटत होती – [मूठभर मांस वाढण्याची.]
![]()
प्रश्न 3.
चूक की बरोबर ते लिहा.
(i) पंत तुरळक तारीफ ऐकून भुलले.
(ii) पंतांनी डाएटच्या आहारी जन्मात न जाण्याचे ठरवले.
(iii) वजनाच्या यंत्रावर पाय ठेवून पंतांनी दोन रुपयाचे नाणे आत टाकले.
उत्तर:
(i) चूक
(i) बरोबर
(iii) चूक
प्रश्न 4.
एका वाक्यात उत्तरे लिहा.
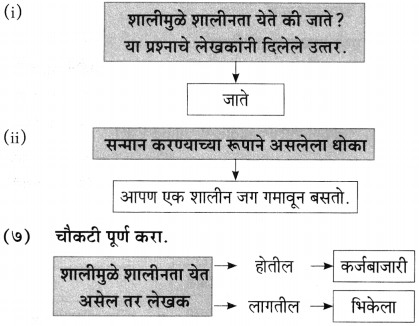
(i) पंतांनी कोणत्या गोष्टींची चिंता करणे सोडून दिले?
उत्तर:
पंतांनी वजन आणि भविष्य या दोन्ही गोष्टींची चिंता करणे सोडून दिले.
(ii) चाळीतील मंडळी कोणत्या गोष्टींची चेष्टा करत होती?
उत्तरः
चाळीतील मंडळी पंतांची, त्यांच्या डाएटची व त्यांच्या उपासाची चेष्टा करत होती.
प्रश्न 5.
रिकाम्या जागी योग्य विधान घालून वाक्य पूर्ण करा.
(i) माझा एकूण निश्चय पाहून चाळीतल्या मंडळीचे आदर दुणावल्याचे …………………………..
(अ) माझ्या सूक्ष्म नजरेतून सुटत नव्हते.
(आ) त्याच्या सूक्ष्म नजरेतून सुटत नव्हते.
(इ) हिच्या सूक्ष्म नजरेतून सुटत नव्हते.
(ई) माझ्या तीक्ष्ण नजरेतून सुटत नव्हते.
उत्तर:
माझा एकूण निश्चय पाहून चाळीतल्या मंडळीचे आदर दुणावल्याचे माझ्या सूक्ष्म नजरेतून सुटत नव्हते.
(ii) ………………………….. या दोन्ही गोष्टींची चिंता करायचे सोडून दिले आहे.
(अ) वजन आणि घट
(आ) वजन आणि भविष्य
(इ) भविष्य आणि चिंता
(ई) वजन आणि काळजी
उत्तरः
वजन आणि भविष्य या दोन्ही गोष्टींची चिंता करायचे सोडून दिले आहे.
![]()
कृती ३: स्वमत
प्रश्न 1.
चाळीतील मंडळींचा उत्साह दुणावल्याचे कोणत्या उद्गारातून स्पष्ट होते?
उत्तरः
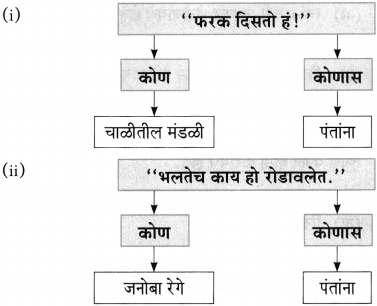
पंतांचा डाएट बद्दलचा एकूण निश्चय पाहून पंतांविषयीचा आदर दुणावला व ते पंतांना जाणवत होते. ज्या मंडळींनी पंतांच्या उपासाची चेष्टा केली त्यांनीच ‘पंत, फरक दिसतोय हं!’ अशी कबुली दयायला सुरुवात केली. जनोबा रेग्यांसारख्या कुजकट शेजाऱ्यालाही ‘पंत, भलतेच काय हो रोडावलेत’ असे मान्य करावे लागले.
प्रश्न 2.
एक महिन्याच्या पंतांच्या उग्र साधनेबद्दल माहिती लिहा.
उत्तर:
पंतांनी आपले वजन घटवण्यासाठी एक महिन्याचा उपास, निराहार, शास्त्रोक्त आहार, दोरीवरच्या उड्या इत्यादी उग्र साधना केली. या साधनेनंतर पंतांना खात्री होती, की आपले वजन वीस ते पंचवीस पौंडांनी घटेल. पंतांनी केलेल्या उपासामुळे त्यांच्यातील फरक लोकांनाही जाणवत होता. त्यामुळे पंतांना नक्की वजन घटणार याची खात्री होती.
प्रश्न 3.
उपास करूनही पंतांचे वजन वाढण्यामागचे कारण कोणते असावे असे तुम्हाला वाटते.
उत्तर:
पंतांनी एक महिन्याचा उपास, निराहार, शास्त्रोक्त आहार, दोरीवरच्या उड्या इत्यादी उग्र साधना केली असे म्हटले असले तरी बिनसाखरेचा समजून साखरेचा चहा, लाडू, पंधरवडाभरात भात वर्ण्य केला असूनही चार वेळा भात खाल्ला होता. एकीकडे निराहार, शास्त्रोक्त आहार घेणारे पंत दुसरीकडे कोण कोणत्या पदार्थांचा आस्वाद घेतला हे मार्मिकतेने सांगतात. एकूण पाठातील उपास हा मार्मिकतेचा विषय असल्यामुळे पंतांच्या वागण्यातील विरोधाभासामुळे वजन घटण्याऐवजी वाढलेले दिसून आले, असे मला वाटते.
स्वाध्याय कृती
स्वमत
प्रश्न 4.
तुम्ही एखादा संकल्प केला आणि तो पूर्ण केला नाही तर कुटुंबातील व्यक्ती कोणत्या प्रतिक्रिया व्यक्त करतील, याची कल्पना करून लिहा.
उत्तरः
नववीची परीक्षा झाली व मी पास होऊन दहावीच्या वर्गात गेले. यावर्षी काहीही करून सकाळी लवकर उठून अभ्यास करायचा असा मी संकल्प केला. नुकतीच मे महिन्याची सुट्टी अनुभवलेली असल्यामुळे लवकर उठायची सवय मोडली होती. आईला मी माझ्या संकल्पाविषयी सांगितले. दुसऱ्या दिवसापासून आईने मला सकाळी पाच वाजता उठवायला सुरुवात केली. पहिल्या दिवशी नवा उत्साह असल्यामुळे मी शहाण्या बाळासारखी उठून बसले.
![]()
शाळा सुरू झाल्यानंतर सुरुवातीला मैत्रिणीबरोबरच्या गप्पा, खेळ, शाळेतील अभ्यास या सर्वांमुळे मला माझ्या संकल्पाविषयी विसर पडू लागला. इतरांबरोबर मजा करणे कमी झाले. कोणतीही गोष्ट करताना मी यंदा दहावीत आहे याची जाणीव करून दिली जाई. सकाळी लवकर उठून अभ्यास करण्याचा माझा संकल्प आई विसरली नव्हती. आईनेच एकदा घरातील सर्वांच्या देखत माझी चेष्टा केली, घरातील लहान भावंडेही माझी मस्करी करू लागली. खेळणे, टि.व्ही. पाहणे हे सारेच मला पारखे झाले. मग मात्र मी निश्चय केला, की आपण कुणाच्याच चेष्टेचा विषय बनू नये, मी केलेला संकल्प पूर्ण करण्यासाठी मनाची तयारी केली व नियमित लवकर उठून अभ्यास नियमित करू लागले.
उपास शब्दार्द्ध
- उपास – निरशन, दिवसभर न जेवणे, निराहार – (fasting, a fast)
- परिवर्तन – मोठा बदल – (a radical change)
- आचारी – स्वयंपाक करणारा – (a cook)
- चमत्कारिक – विक्षिप्त, विचित्र – (strange, odd)
- मौन – न बोलणे – (silence)
- धारोष्ण – नुकतीच धार काढली आहे असे ताजे दूध – (fresh immediately after milking)
- सामर्थ्य – शक्ती, बळ, क्षमता – (power, ability)
- पश्चात्ताप – खेद, अनुताप – (respentance)
- वाक्प्रवाह – अखंड बोलणे – (a flow of speech)
- एकाग्रता – एकाच गोष्टीत पूर्ण लक्ष असणे – (concentration)
- शास्त्रोक्त – शास्त्रात नमूद केल्याप्रमाणे – (scientific)
- भविष्य – भावी गोष्टीचे पूर्वकथन, भाकीत – (prediction)
- पौष्टिक – ताकद वाढवणारे – (nutritious)
- सात्विक – सत्वगुणी, शुद्ध, पवित्र – (pure, god fearing)
- दुर्दैव – अभागी, कमनशिबी – (unfortunate, unlucky)
- उग्रसाधना – दुःसह तपश्चर्या – (learning the hard way, penance)
- आहार – नेहमी खाण्याचे अन्न – (adiet)
- आणेली – जुन्या काळातील एक नाणे – (old currency coin)
- वर्य – टाळण्याजोगे, वगळण्याजोगे – (fit to be avoided)
- खाजगी – स्वत:चा – (private)
- उपोषण – अन्न–पाणी वयं करणे – (fasting)
- टीका – गुणदोषांचे विवरण – (criticism)
- प्रैंड – वजन मोजण्याचे परिमाण – (weight measuring element)
- घोरणे – (to snore)
- आहारशास्त्र – (sitology)
- शास्त्र – (येथे अर्थ) कला
- तज्ज्ञ – जाणकार, ज्ञानी – (expert)
- घटेल – घटणे, कमी होणे – (reduce)
- सल्ला – उपदेश – (to advice)
- लोणी – (butter)
- तूप – (ghee)
- आहारपरिवर्तन– जेवणातला बदल – (change in diet)
- वर्ण्य करणे – त्याग करणे – (to avoid)
- सुरळीत – व्यवस्थित – (smoothly)
- कचेरी – कार्यालय – (office)
- कुंभ रास – (aquarius)
- वायू – हवा – (air)
- दोरीवरच्या उड्या – (skipping)
- अवर्णनीय – वर्णन करता न येणारे – (indescribable)
- पडवळ – एक भाजी – (snake gourd)
- शेवग्याच्या शेंगा – (drum sticks)
- भेंडी – एक भाजी – (lady finger)
- संयम – ताबा – (control)
- कटाक्ष – डोळ्यांच्या कोपऱ्यातून टाकलेला दृष्टिक्षेप – (a glance)
- अमृत – पीयुष, सुधा – (rector)
- गोठा – गुरे बांधण्याची जागा – (cow shed)
- कुजकट – (येथे अर्थ) वाईट
- तुरळक – क्वचित घडणारी – (rarely)
- जिव्हा – जीभ – (tongue)