Balbharati Maharashtra State Board 11th Commerce Maths Solution Book Pdf Chapter 1 Partition Values Ex 1.3 Questions and Answers.
Maharashtra State Board 11th Commerce Maths Solutions Chapter 1 Partition Values Ex 1.3
Question 1.
The following table gives the frequency distribution of marks of 100 students in an examination.

Determine D6, Q1, and P85 graphically.
Solution:
To draw an ogive curve, we construct the less than cumulative frequency table as given below:
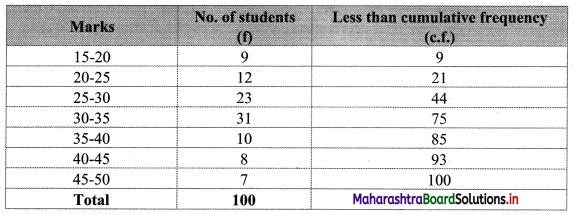
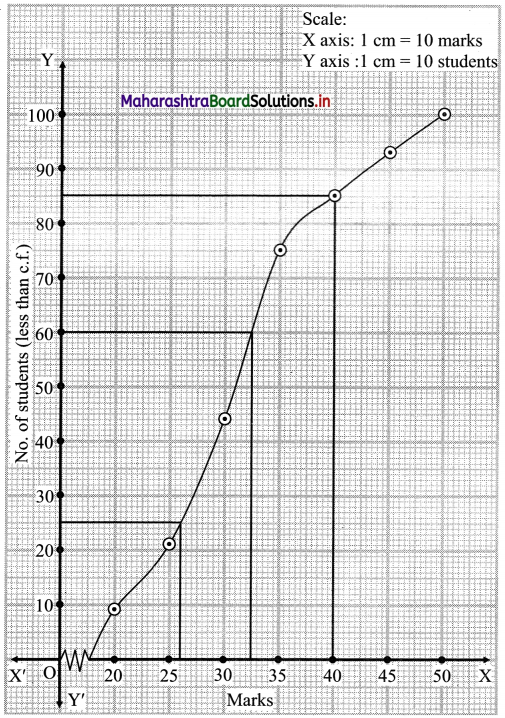
The points to be plotted for less than ogive are (20, 9), (25, 21), (30, 44), (35, 75), (40, 85), (45, 93), (50, 100).
Here, N = 100
For D6, \(\frac{6 \mathrm{~N}}{10}=\frac{6 \times 100}{10}\) = 60
For Q1, \(\frac{\mathrm{N}}{4}=\frac{100}{4}\) = 25
For P85, \(\frac{85 \mathrm{~N}}{100}=\frac{85 \times 100}{100}\) = 85
∴ We take the points having Y co-ordinates 60, 25 and 85 on Y-axis.
From these points, we draw lines parallel to X-axis.
From the points where these lines intersect the curve, we draw perpendiculars on X-axis.
X co-ordinates of these points give the values of D6, Q1 and P85.
∴ D6 = 32.5, Q1 = 26, P85 = 40
![]()
Question 2.
The following table gives the distribution of daily wages of 500 families in a certain city.
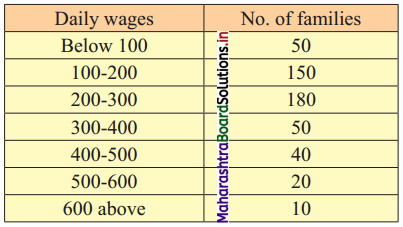
Draw a ‘less than’ ogive for the above data. Determine the median income and obtain the limits of income of central 50% of the families.
Solution:
To draw an ogive curve, we construct the less than cumulative frequency table as given below:
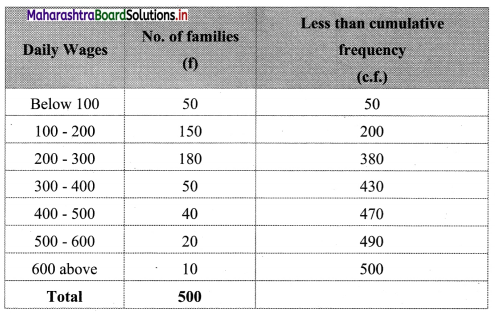
The points to be plotted for less than ogive are (100, 50), (200, 200), (300, 380), (400, 430), (500, 470), (600, 490) and (700, 500).
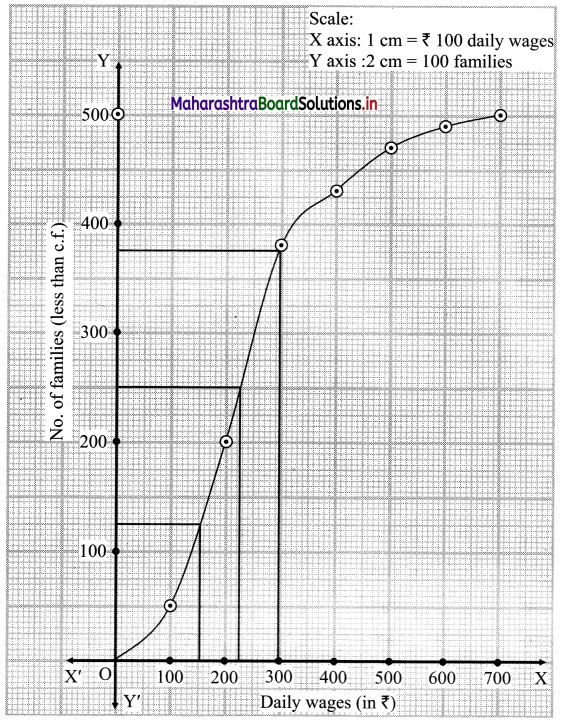
Here, N = 500
For Q1, \(\frac{\mathrm{N}}{4}=\frac{500}{4}\) = 125
For Q2, \(\frac{\mathrm{N}}{2}=\frac{500}{2}\) = 250
For Q3, \(\frac{3 \mathrm{~N}}{4}=\frac{3 \times 500}{4}\) = 375
∴ We take the points having Y co-ordinates 125, 250 and 375 on Y-axis.
From these points we draw lines parallel to X-axis.
From the points where these lines intersect the curve, we draw perpendiculars on X-axis.
X-Co-ordinates of these points give the values of Q1, Q2 and Q3.
∴ Q1 ~ 150, Q2 ~ 228, Q3 ~ 297
∴ Median = 228
50% families lie between Q1 and Q3
∴ Limits of income of central 50% families are from ₹ 150 to ₹ 297
Question 3.
From the following distribution, determine the median graphically.
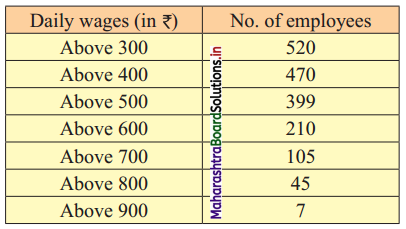
Solution:
To draw an ogive curve, we construct the less than and more than cumulative frequency table as given below:
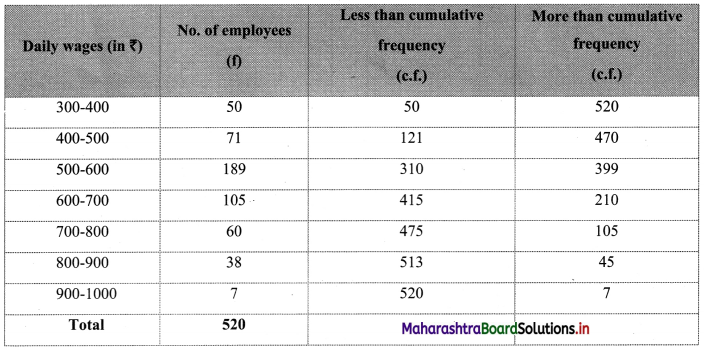
The points to be plotted for less than ogive are (400, 50), (500, 121), (600, 310), (700, 415), (800, 475), (900, 513) and (1000, 520) and that for more than ogive are (300, 520), (400, 470), (500, 399), (600, 210), (700, 105), (800, 45), (900, 7).
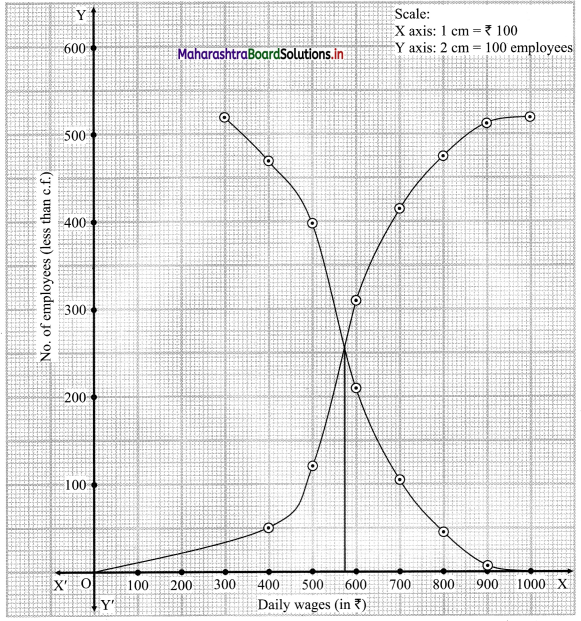
From the point of intersection of two ogives, we draw a perpendicular on X-axis.
The point where it meets the X-axis gives the value of the median.
∴ Median ~ 574
![]()
Question 4.
The following frequency distribution shows the profit (in ₹) of shops in a particular area of the city.
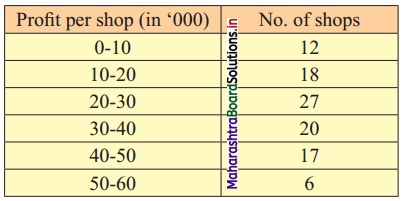
Find graphically
(i) the Unfits of middle 40% shops.
(ii) the number of shops having a profit of fewer than 35,000 rupees.
Solution:
To draw an ogive curve, we construct a less than cumulative frequency table as given below:

Points to be plotted are (10, 12), (20, 30), (30, 57), (40, 77), (50, 94), (60, 100).
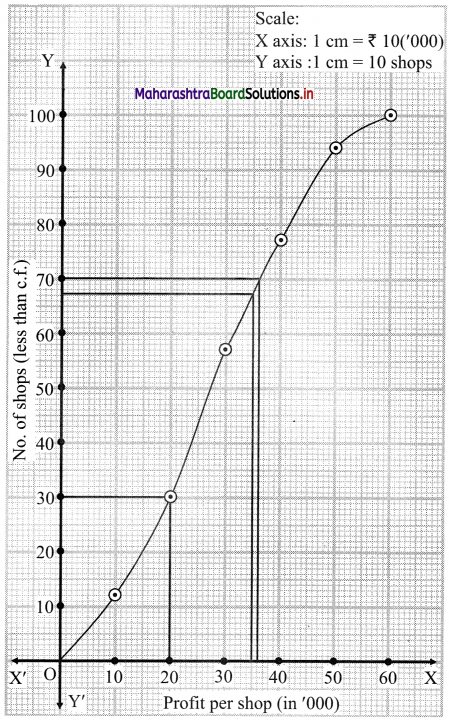
The Middle 40% value lies in between P30 and P70.
N = 100
For P30 = \(\frac{30 \mathrm{~N}}{100}=\frac{30 \times 100}{100}\) = 30
For P70 = \(\frac{70 \mathrm{~N}}{100}=\frac{70 \times 100}{100}\) = 70
∴ We take the points having Y co-ordinates 30 and 70 on Y-axis. From these points we draw lines parallel to X-axis.
From the points where these lines intersect the curve, we draw perpendiculars on X-axis.
X-Co-ordinates of these points give the values of P30 and P70.
∴ P30 ~ 20, P70 ~ 36
Limits of middle 40% shops lie between ₹ 20,000 to ₹ 36,000
To find the number of shops having a profit of less than ₹ 35,000, we take the value 35 on the X-axis.
From this point, we draw a line parallel to Y-axis, and from the point where it intersects the less than ogive we draw a perpendicular on Y-axis. It intersects the Y-axis at approximately 67.
∴ No. of shops having profit less than ₹ 35,000 is 67.
Question 5.
The following is the frequency distribution of overtime (per week) performed by various workers from a certain company. Determine the values of D2, Q2, and P61 graphically.

Solution:
To draw an ogive curve, we construct a less than cumulative frequency table as given below:
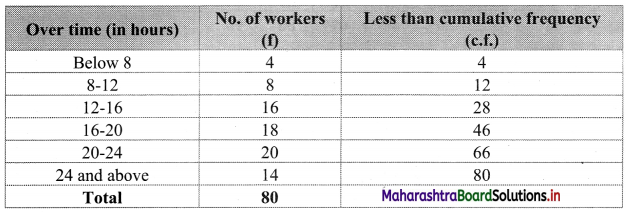
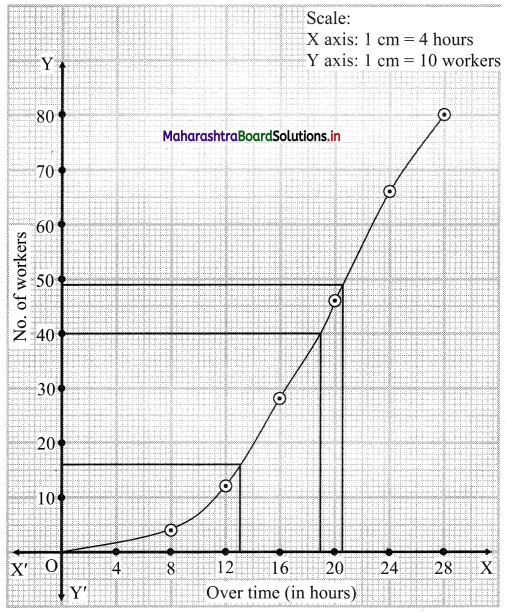
Points to be plotted are (8, 4), (12, 12), (16, 28), (20, 46), (24, 66) and (28, 80)
Here, N = 80
For D2, we have to consider \(\frac{2 \mathrm{~N}}{10}=\frac{2 \times 80}{10}\) = 16
For Q2, we have to consider \(\frac{\mathrm{N}}{2}=\frac{80}{2}\) = 40
and for P61, we have to consider \(\frac{61 \mathrm{~N}}{100}=\frac{61 \times 80}{100}\) = 48.8
∴ We consider the values 16, 40 and 48.8 on the Y-axis.
From these points, we draw the lines which are parallel to the X-axis.
From the points where they intersect the less than ogive, we draw perpendiculars to X-axis.
The values at the foot of perpendiculars represent the values of D2, Q2, and P61 respectively.
∴ D2 ~ 13, Q2 ~ 19, P61 ~ 20.5
![]()
Question 6.
Draw ogive for the following data and hence find the values of D1, Q1, and P40.

Solution:
N = 100
To draw the less than ogive we have to plot the points (10, 4), (20, 6), (30, 24), (40, 46), (50, 67), (60, 86), (70, 96), (80, 99), (90, 100).
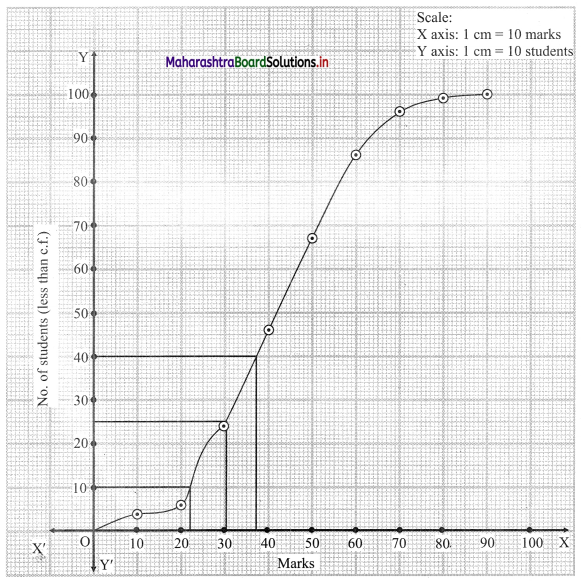
For D1, we have to consider \(\frac{\mathrm{N}}{10}=\frac{100}{10}\) = 10
For Q1, we have to consider \(\frac{\mathrm{N}}{4}=\frac{100}{4}\) = 25
For P40, we have to consider \(\frac{40 \mathrm{~N}}{100}=\frac{40 \times 100}{100}\) = 40
∴ We consider the values 10, 25 and 40 on the Y-axis. From these points we draw lines parallel to X-axis.
From the points where they intersect the less than ogive, we draw perpendiculars on the X-axis.
The values at the foot of perpendicular represent the values of D1, Q1 and P40 respectively.
∴ D1 ~ 22, Q1 ~ 30.5, P40 ~ 37
Question 7.
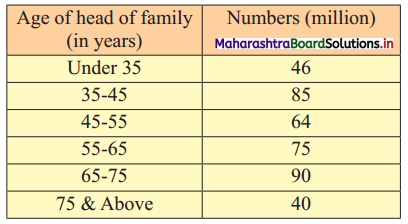
The following table shows the age distribution of heads of the families in a certain country. Determine the third, fifth, and eighth decile of the distribution graphically.
Solution:
To draw an ogive curve, we construct a less than cumulative frequency table as given below:
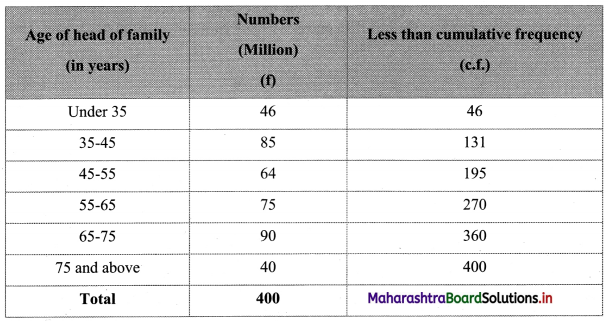
Points to be plotted are (35, 46), (45, 131), (55, 195), (65, 270), (75, 360), (85, 400).
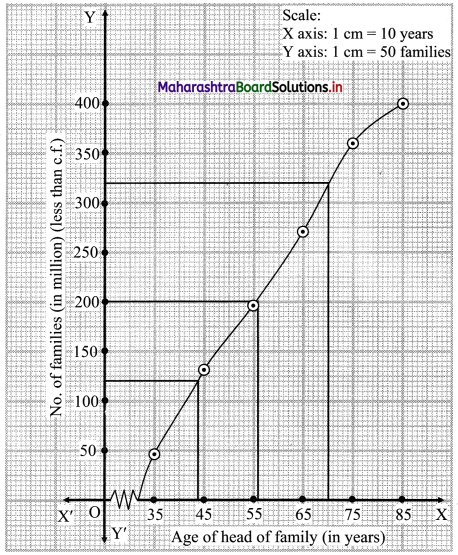
N = 400
For D3, we have to consider \(\frac{3 \mathrm{~N}}{10}=\frac{3 \times 400}{10}\) = 120
For D5, we have to consider \(\frac{5 \mathrm{~N}}{10}=\frac{5 \times 400}{10}\) = 200
For D8, we have to consider \(\frac{8 \mathrm{~N}}{10}=\frac{8 \times 400}{10}\) = 320
∴ We consider the values 120, 200 and 320 on Y-axis. From these points we draw the lines parallel to X-axis.
From the points where they intersect the less than ogive, we draw perpendiculars on the X-axis.
The foot of perpendicular represent the values of D3, D5 and D8.
∴ D3 ~ 44, D5 ~ 55.5 and D8 ~ 70
![]()
Question 8.
The following table gives the distribution of females in an Indian village. Determine the median age graphically.

Solution:
To draw an ogive curve, we construct the less than cumulative frequency table as given below:

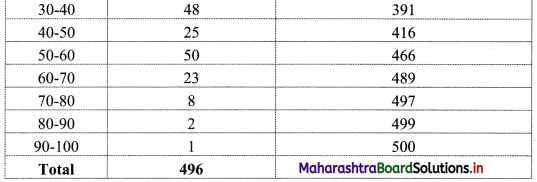
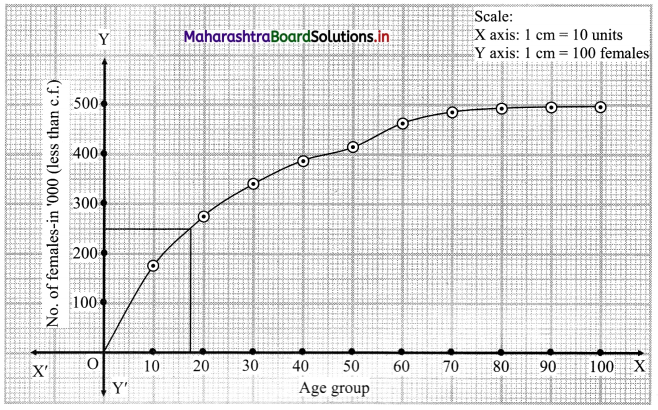
Points to be plotted are (10, 175), (20, 275), (30, 343), (40, 391), (50, 416), (60, 466), (70, 489), (80, 497), (90, 499), (100, 500).
N = 500
For median we have to consider \(\frac{\mathrm{N}}{2}=\frac{500}{2}\) = 250
∴ We consider the value 250 on Y-axis. From this point, we draw a line parallel to X-axis.
From the point it intersects the less than ogive, we draw a perpendicular to X-axis.
The foot perpendicular represents the value of the median.
∴ Median ~ 17.5
Question 9.
Draw ogive for the following distribution and hence find graphically the limits of the weight of middle 50% fishes.

Solution:
Since the given data is not continuous, we have to convert it into the continuous form by subtracting 5 from the lower limit and adding 5 to the upper limit of every class interval.
To draw an ogive curve, we construct the less than cumulative frequency table as given below:
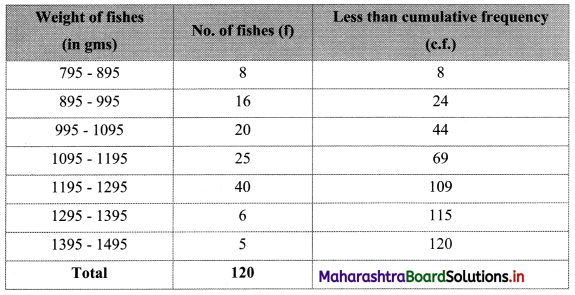
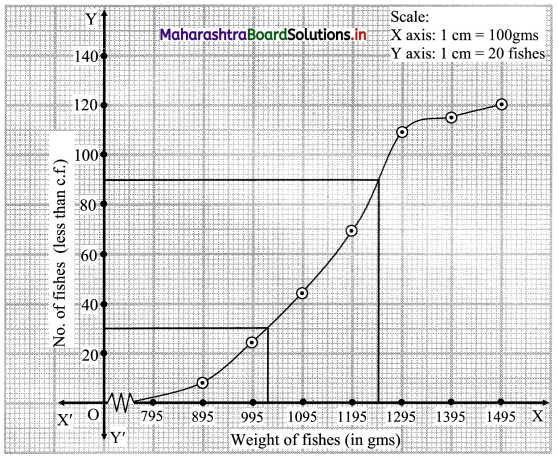
Points to be plotted are (895, 8), (995, 24), (1095, 44), (1195, 69), (1295, 109), (1395, 115), (1495, 120).
N = 120
For Q1 and Q3 we have to consider
\(\frac{\mathrm{N}}{4}=\frac{120}{4}\) = 30
\(\frac{3 \mathrm{~N}}{4}=\frac{3 \times 120}{4}\) = 90
For finding Q1 and Q3 we consider the values 30 and 90 on the Y-axis.
From these points, we draw the lines which are parallel to X-axis.
From the points where these lines intersect the less than ogive, we draw perpendicular on X-axis.
The feet of perpendiculars represent the values Q1 and Q2.
∴ Q1 ~ 1025 and Q3 ~ 1248
∴ the limits of the weight of the middle 50% of fishes lie between 1025 to 1248.
![]()
Question 10.
Find graphically the values of D3 and P65 for the data given below:

Solution:
Since the given data is not continuous, we have to convert it into a continuous form by subtracting 0.5 from the lower limit and adding 0.5 to the upper limit of every class interval.
To draw an ogive curve, we construct the less than cumulative frequency table as given below:
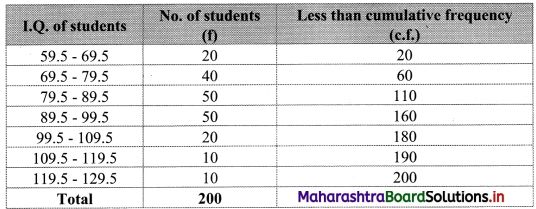
Points to be plotted are (69.5, 20), (79.5, 60), (89.5, 110), (99.5, 160), (109.5, 180), (119.5, 190), (129.5, 200).
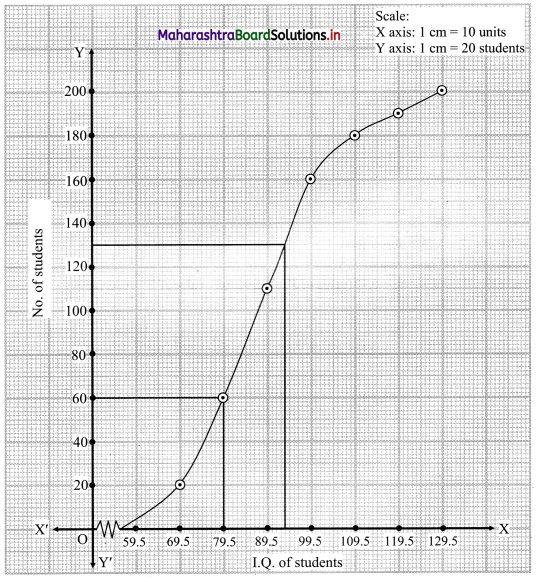
N = 200
For D3, \(\frac{3 \mathrm{N}}{10}=\frac{3 \times 200}{10}\) = 60
For P65, \(\frac{65 \mathrm{N}}{100}=\frac{65 \times 200}{100}\) = 130
∴ We take the values 60 and 130 on the Y-axis.
From these points we draw lines parallel to X-axis and from the points where these lines intersect less than ogive, we draw perpendiculars on X-axis.
The foot of perpendiculars represents the median of the values, D3 and P65.
∴ D3 = 79.5, P65 = 93.5