Balbharti Maharashtra State Board Class 9 Maths Solutions covers the Problem Set 7 Algebra 9th Class Maths Part 1 Answers Solutions Chapter 7 Statistics.
Problem Set 7 Algebra 9th Std Maths Part 1 Answers Chapter 7 Statistics
Question 1.
Write the correct alternative answer for each of the following questions.
i. Which of the following data is not primary ?
(A) By visiting a certain class, gathering information about attendance of students.
(B) By actual visit to homes, to find number of family members.
(C) To get information regarding plantation of soyabean done by each farmer from the village Talathi.
(D) Review the cleanliness status of canals by actually visiting them.
Answer:
(C) To get information regarding plantation of soyabean done by each farmer from the village Talathi.
ii. What is the upper class limit for the class 25 – 35?
(A) 25
(B) 35
(C) 60
(D) 30
Answer:
(B) 35
iii. What is the class-mark of class 25 – 35?
(A) 25
(B) 35
(C) 60
(D) 30
Answer:
(D) 30
iv. If the classes are 0 – 10, 10 – 20, 20 – 30, …, then in which class should the observation 10 be included?
(A) 0 – 10
(B) 10 – 20
(C) 0 – 10 and 10-20 in these 2 classes
(D) 20 – 30
Answer:
(B) 10 – 20
v. If \(\overline { x }\) is the mean of x1, x2, ……. , xn and \(\overline { y }\) is the mean of y1, y2, ….. yn and \(\overline { z }\) is the mean of x1,x2, …… , xn , y1, y2, …. yn , then z = ?
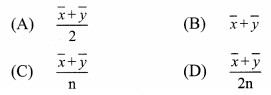
Answer:
x1, x2, x3, ……. , xn
∴ \(\overline{x}=\frac{\sum x}{\mathrm{n}}\)
∴ n\(\overline{x}\) = ∑x
Similarly, n\(\overline{y}\) = ∑y
Now,
![]()
\(\text { (A) } \frac{\overline{x}+\overline{y}}{2}\)
vi. The mean of five numbers is 50, out of which mean of 4 numbers is 46, find the 5th number.
(A) 4
(B) 20
(C) 434
(D) 66
Answer:
5th number = Sum of five numbers – Sum of four numbers
= (5 x 50) – (4 x 46)
= 250 – 184
= 66
(D) 66
vii. Mean of 100 observations is 40. The 9th observation is 30. If this is replaced by 70 keeping all other observations same, find the new mean.
(A) 40.6
(B) 40.4
(C) 40.3
(D) 40.7
Answer:
New mean = \(\frac { 4000-30+70 }{ 100 }\)
= 40.4
(B) 40.4
viii. What is the mode of 19, 19, 15, 20, 25, 15, 20, 15?
(A) 15
(B) 20
(C) 19
(D) 25
Answer:
(A) 15
ix. What is the median of 7, 10, 7, 5, 9, 10 ?
(A) 7
(B) 9
(C) 8
(D) 10
Answer:
(C) 8
x. From following table, what is the cumulative frequency of less than type for the class 30 – 40?
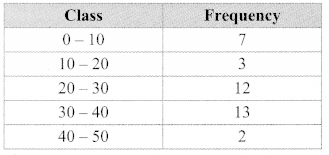
(A) 13
(B) 15
(C) 35
(D) 22
Answer:
Cumulative frequency of less than type for the class 30 – 40 = 7 + 3 + 12 + 13 = 35
(C) 35
Question 2.
The mean salary of 20 workers is ₹10,250. If the salary of office superintendent is added, the mean will increase by ₹ 750. Find the salary of the office superintendent.
Solution:
\( \text { Mean }=\frac{\text { The sum of all observations }}{\text { Total number of observations }}\)
∴ The sum of all observations = Mean x Total number of observations
The mean salary of 20 workers is ₹ 10,250.
∴ Sum of the salaries of 20 workers
= 20 x 10,250
= ₹ 2,05,000 …(i)
If the superintendent’s salary is added, then mean increases by 750
new mean = 10, 250 + 750 = 11,000
Total number of people after adding superintendent = 20 + 1 = 21
∴ Sum of the salaries including the superintendent’s salary = 21 x 11,000 = ₹ 2,31,000 …(ii)
∴ Superintendent salary = sum of the salaries including superintendent’s salary – sum of salaries of 20 workers
= 2, 31,00 – 2,05,000 …[From (i) and (ii)]
= 26,000
∴ The salary of the office superintendent is ₹ 26,000.
Question 3.
The mean of nine numbers is 77. If one more number is added to it, then the mean increases by 5. Find the number added in the data.
Solution:
∴ \( \text { Mean }=\frac{\text { The sum of all observations }}{\text { Total number of observations }}\)
∴ The sum of all observations = Mean x Total number of observations mean of nine numbers is 77
∴ sum of 9 numbers = 11 x 9 = 693 …(i)
If one more number is added, then mean increases by 5
mean of 10 numbers = 77 + 5 = 82
∴ sum of the 10 numbers = 82 x 10 = 820 …(ii)
∴ Number added = sum of the 10 numbers – sum of the 9 numbers = 820 – 693 … [From (i) and (ii)]
= 127
∴ The number added in the data is 127.
Question 4.
The monthly maximum temperature of a city is given in degree Celsius in the following data. By taking suitable classes, prepare the grouped frequency distribution table
29.2, 29.0, 28.1, 28.5, 32.9, 29.2, 34.2, 36.8, 32.0, 31.0, 30.5, 30.0, 33, 32.5, 35.5, 34.0, 32.9, 31.5, 30.3, 31.4, 30.3, 34.7, 35.0, 32.5, 33.5.29.0. 29.5.29.9.33.2.30.2
From the table, answer the following questions.
i. For how many days the maximum temperature was less than 34°C?
ii. For how many days the maximum temperature was 34°C or more than 34°C?
Solution:
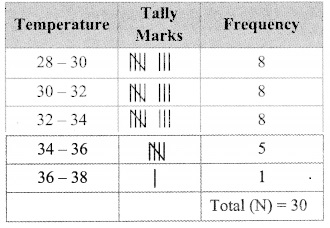
i. Number of days for which the maximum temperature was less than 34°C
= 8 + 8 + 8 = 24
ii. Number of days for which the maximum temperature was 34°C or more than 34°C
= 5 + 1 = 6
Question 5.
If the mean of the following data is 20.2, then find the value of p.
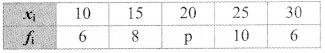
Solution:
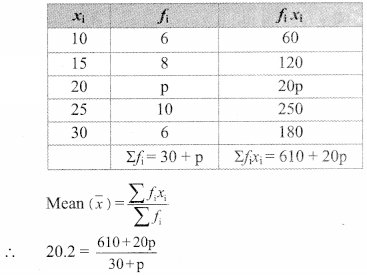
∴ 20.2 (30 + p) = 610 + 20p
∴ 606 + 20.2p = 610 + 20p
∴ 20.2p – 20p = 610 – 606
∴ 0.2p = 4
∴ p = \(\frac { 4 }{ 0.2 }\) = \(\frac { 40 }{ 2 }\) = 20
∴ p = 20
Question 6.
There are 68 students of 9th standard from Model Highschool, Nandpur. They have scored following marks out of 80, in written exam of mathematics.
70, 50, 60, 66, 45, 46, 38, 30, 40, 47, 56, 68,
80, 79, 39, 43, 57, 61, 51, 32, 42, 43, 75, 43,
36, 37, 61, 71, 32, 40, 45, 32, 36, 42, 43, 55,
56, 62, 66, 72, 73, 78, 36, 46, 47, 52, 68, 78,
80, 49, 59, 69, 65, 35, 46, 56, 57, 60, 36, 37,
45, 42, 70, 37,45, 66, 56, 47
By taking classes 30 – 40, 40 – 50, …. prepare the less than type cumulative frequency table. Using the table, answer the following questions:
i. How many students have scored marks less than 80?
ii. How many students have scored marks less than 40?
iii. How many students have scored marks less than 60?
Solution:
Class
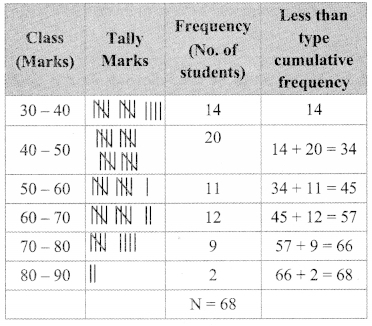
i. 66 students have scored marks less than 80.
ii. 14 students have scored marks less than 40.
iii. 45 students have scored marks less than 60.
Question 7.
By using data in example (6), and taking classes 30 – 40, 40 – 50,… prepare equal to or more than type cumulative frequency table and answer the following questions based on it.
i. How many students have scored marks 70 or more than 70?
ii. How many students have scored marks 30 or more than 30?
Solution:
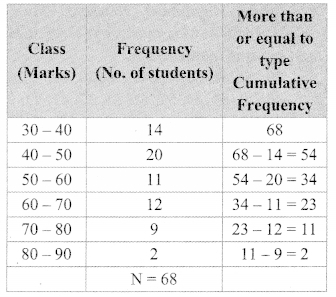
i. 11 students have scored marks 70 or more than 70.
ii. 68 students have scored marks 30 or more than 30.
Question 8.
There are 10 observations arranged in ascending order as given below.
45, 47, 50, 52, JC, JC + 2, 60, 62, 63, 74. The median of these observations is 53.
Find the value of JC. Also find the mean and the mode of the data.
Solution:
i. Given data in ascending order:
45,47, 50, 52, x, JC+2, 60, 62, 63, 74.
∴ Number of observations (n) = 10 (i.e., even)
∴ Median is the average of middle two observations
Here, the 5th and 6th numbers are in the middle position.
∴ 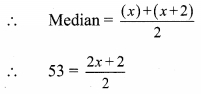
∴ 106 = 2x + 2
∴ 106 – 2 = 2x
∴ 104 = 2x
∴ x = 52
∴ The given data becomes:
45, 47, 50, 52, 52, 54, 60, 62, 63, 74.
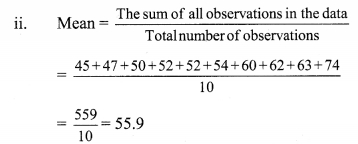
∴ The mean of the given data is 55.9.
iii. Given data in ascending order:
45, 47, 50, 52, 52, 54, 60, 62, 63, 74.
∴ The observation repeated maximum number of times = 52
∴ The mode of the given data is 52.
Maharashtra Board Class 9 Maths Chapter 7 Statistics Problem Set 7 Intext Questions and Activities
Question 1.
To show following information diagrammatically, which type of bar- diagram is suitable?
i. Literacy percentage of four villages.
ii. The expenses of a family on various items.
iii. The numbers of girls and boys in each of five divisions.
iv. The number of people visiting a science exhibition on each of three days.
v. The maximum and minimum temperature of your town during the months from January to June.
vi. While driving a two-wheeler, number of people wearing helmets and not wearing helmet in 100 families.
(Textbook pg. no. 112)
Solution:
i. Percentage bar diagram
ii. Sub-divided bar diagram
iii. Sub-divided bar diagram
iv. Sub-divided bar diagram
v. Sub-divided bar diagram
vi. Sub-divided bar diagram
Question 2.
You gather information for several reasons. Take a few examples and discuss whether the data is primary or secondary.
(Textbook pg. no, 113)
[Students should attempt the above activity on their own.]