Balbharti Maharashtra State Board Class 10 Maths Solutions covers the Practice Set 6.6 Algebra 10th Class Maths Part 1 Answers Solutions Chapter 6 Statistics.
Practice Set 6.6 Algebra 10th Std Maths Part 1 Answers Chapter 6 Statistics
Question 1.
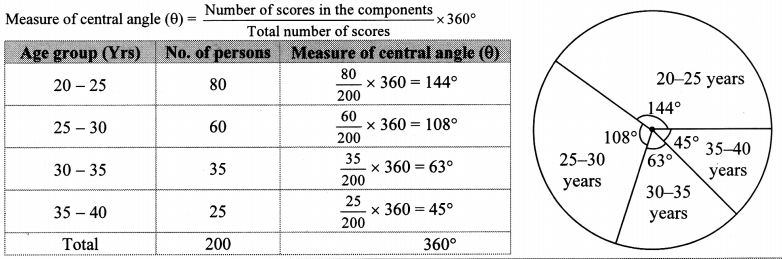
The age group and number of persons, who donated blood in a blood donation camp is given below.
Draw a pie diagram from it.

Solution:
Total number of persons = 80 + 60 + 35 + 25 = 200
Question 2.
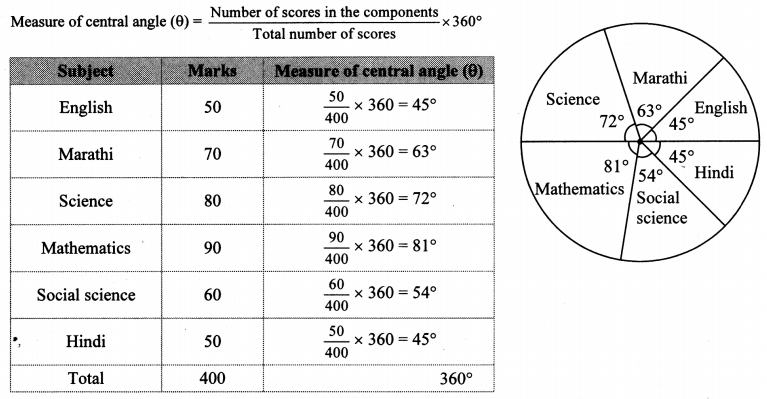
The marks obtained by a student in different subjects are shown. Draw a pie diagram showing the information.

Solution:
Total marks obtained = 50 + 70 + 80 + 90 + 60 + 50 = 400
Question 3.
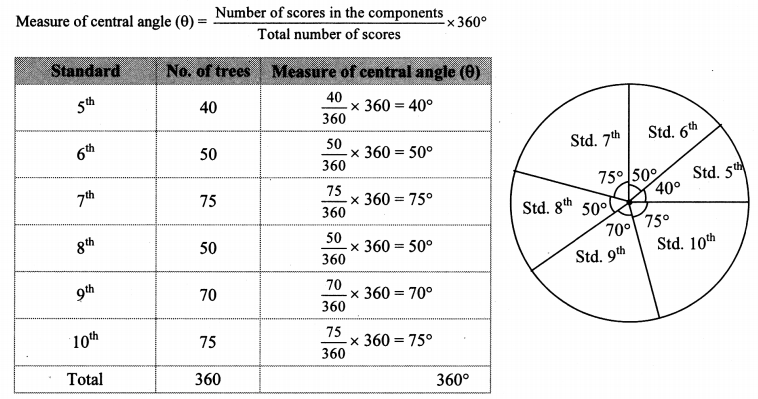
In a tree plantation programme, the number of trees planted by students of different classes is given in the following table. Draw a pie diagram showing the information.

Solution:
Total number of trees planted = 40 + 50 + 75 + 50 + 70 + 75 = 360
Question 4.
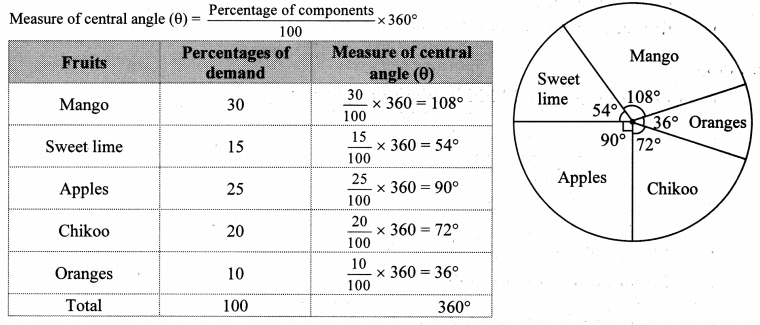
The following table shows the percentages of demands for different fruits registered with a fruit vendor. Show the information by a pie diagram.

Solution:
Total percentage = 30 + 15 + 25 + 20 + 10 = 100%
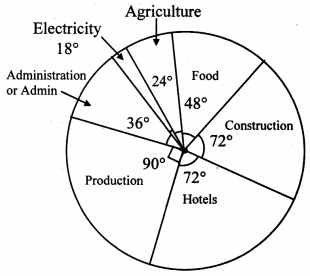
Question 5.
The pie diagram in the given figure shows the proportions of different workers in a town. Answer the following questions with its help.
i. If the total workers is 10,000, how many of them are in the field of construction?
ii. How many workers are working in the administration?
iii. What is the percentage of workers in production?
Solution:
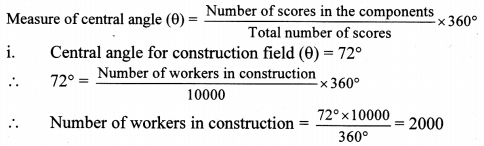
∴ There are 2000 workers working in the field of construction.
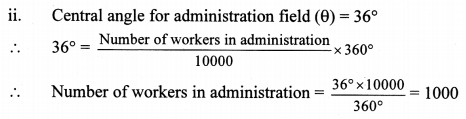
∴ There are 1000 workers working in the administration.
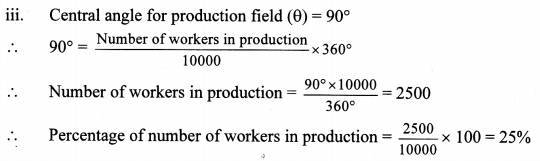
∴ 25% of workers are working in the production field.
Question 6.
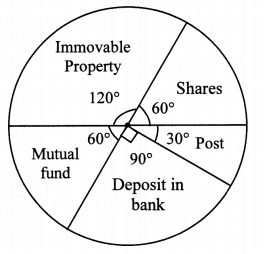
The annual investments of a family are shown in the given pie diagram. Answer the following questions based on it.
i. If the investment in shares is ? 2000, find the total investment.
ii. How much amount is deposited in bank?
iii. How much more money is invested in immovable property than in mutual fund?
iv. How much amount is invested in post?
Solution:
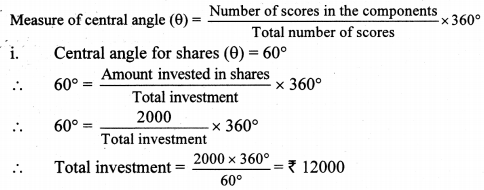
The total investment is ₹ 12000.
ii. Central angle for deposit in bank (θ) = 90°
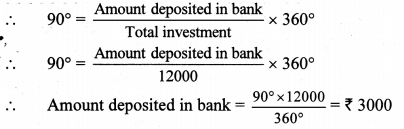
∴ The amount deposited in bank is ₹ 3000.
iii. Difference in central angle for immovable property and mutual fund (θ) = 120° – 60° = 60°
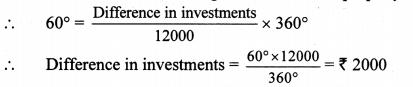
∴ ₹ 2000 more is invested in immovable property than in mutual fund.
iv. Central angle for post (θ) = 30°
∴ The amount invested in post is ₹ 1000.